Table of Contents
Filed Pursuant to Rule 424(b)(4)
Registration Statement No. 333-233198
Registration
Statement No. 333-233963
PROSPECTUS
6,620,686 Class A Common Shares

Global Ship Lease, Inc.
Class A Common Shares
We are offering 6,620,686 Class A common shares in this offering.
Our Class A common shares are listed on the New York Stock Exchange, or the NYSE, under the symbol “GSL.” On September 26, 2019, the last recorded sale price of our common shares on the NYSE was $7.76.
Investing in our Class A common shares involves a high degree of risk. See “Risk Factors” beginning on page 23 of this prospectus for a discussion of information that should be considered in connection with an investment in our securities.
Neither the U.S. Securities and Exchange Commission nor any state securities commission has approved or disapproved of these securities or determined if this prospectus is truthful or complete. Any representation to the contrary is a criminal offense.
| Per Share |
Total | |||||||
| Public offering price |
$ | 7.25 | $ | 47,999,974 | ||||
| Underwriting discounts and commissions(1) |
$ | 0.47 | $ | 3,032,309 | ||||
| Proceeds to the company, before expenses |
$ | 6.79 | $ | 44,967,665 | ||||
| (1) | Excluding 168,965 shares sold to members of our executive management at the public offering price for which the underwriter will not receive any discount and commissions. See “Underwriting (Conflicts of Interest)” for additional information about underwriting compensation. |
We have granted the underwriter the option for a period of up to 30 days to purchase up to an additional 993,102 shares.
As part of this offering, certain members of our executive management have agreed to purchase a total of 168,965 Class A common shares at the public offering price resulting in a gross proceeds of $1,224,996. The underwriter will not receive any discount and commissions on the sale of such shares.
The underwriters expect to deliver the Class A common shares to purchasers on or about October 1, 2019.
B. Riley FBR
The date of this prospectus is September 26, 2019
Table of Contents
| 1 | ||||
| 16 | ||||
| 16 | ||||
| 17 | ||||
| 18 | ||||
| 22 | ||||
| 23 | ||||
| 26 | ||||
| 27 | ||||
| 28 | ||||
| 29 | ||||
| 30 | ||||
| THE INTERNATIONAL CONTAINER SHIPPING AND CONTAINERSHIP LEASING INDUSTRY |
33 | |||
| 66 | ||||
| 76 | ||||
| 79 | ||||
| SECURITY OWNERSHIP OF CERTAIN BENEFICIAL OWNERS AND MANAGEMENT |
83 | |||
| 85 | ||||
| 88 | ||||
| 97 | ||||
| 104 | ||||
| 105 | ||||
| 105 | ||||
| 105 | ||||
| 107 |
You should rely only on the information contained in this prospectus or in any free writing prospectus we may authorize to be delivered to you. We have not, and the underwriters have not, authorized any other person to provide you with additional, different or inconsistent information. If anyone provides you with additional, different or inconsistent information, you should not rely on it. We may not sell these securities until the registration statement filed with the Securities and Exchange Commission, (the “SEC” or “Commission”), is effective. We are not, and the underwriters are not, making an offer to sell these securities in any jurisdiction where the offer or sale is not permitted. You should not assume that the information appearing in this prospectus is accurate as of any date other than the date on the front cover of this prospectus unless otherwise specified herein. Our business, financial condition, results of operations and prospects may have changed since that date. Information contained on our website does not constitute part of this prospectus.
We have not taken any action to permit a public offering of these securities outside the United States or to permit the possession or distribution of this prospectus outside the United States. Persons outside the United States who come into possession of this prospectus must inform themselves about and observe any restrictions relating to the offering of these securities and the distribution of this prospectus outside the United States.
Table of Contents
This summary highlights certain of the information that appears later in this prospectus or in other documents incorporated by reference in this prospectus. This summary may not contain all of the information that may be important to you. As an investor, you should carefully review the entire prospectus, including the section of this prospectus entitled “Risk Factors” and the more detailed information that appears later in this prospectus or is contained in the documents that we incorporate by reference in this prospectus before making an investment in our Class A common shares. The information presented in this prospectus assumes, unless otherwise indicated, that the underwriters’ option to purchase additional Class A common shares is not exercised.
Unless the context otherwise requires, references to the “Company,” “we,” “us,” “our” or “Global Ship Lease” refer to Global Ship Lease, Inc., “CMA CGM” refers to CMA CGM S.A., currently our principal charterer, “Poseidon Containers” refers to Poseidon Containers Holdings LLC and K&T Marine LLC, collectively, with whom we completed a strategic combination on November 15, 2018, Technomar Shipping Inc. (“Technomar”) refers to our ship technical manager (“Technical Manager”), ConChart Commercial Inc. (“Conchart”) refers to our commercial ship manager (“Commercial Manager”, and together with Technomar the “Managers”), and “MSI” refers to Maritime Strategies International Limited, our industry expert. Unless otherwise indicated, all references to “$” and “dollars” in this prospectus are to U.S. dollars. We use the term “TEU”, meaning twenty-foot equivalent unit, the international standard measure of container size, in describing volumes in world container trade and other measures, including the capacity of our containerships, which we also refer to as ships. Unless otherwise indicated, we calculate the average age of our ships on a weighted average basis, based on TEU capacity. References to our 2018 Annual Report refer to our Annual Report on Form 20-F for the fiscal year ended December 31, 2018, that was filed with the SEC on March 29, 2019, which is incorporated herein by reference.
On March 25, 2019, we effected a one-for-eight reverse stock split of our Class A common shares. All share and per share amounts disclosed in this prospectus have been retroactively adjusted to reflect the reverse stock split.
Our Company
Global Ship Lease, Inc. is a Republic of the Marshall Islands corporation that owns a fleet of mid-sized and smaller containerships which are chartered out under fixed-rate charters to reputable container shipping companies (“liner companies” or “liner operators”).
We were formed in 2007 to purchase and charter back 17 containerships owned or to be purchased by CMA CGM, then the third largest containership operator in the world by number of ships.
On November 15, 2018, we completed a transformative transaction and acquired Poseidon Containers’ 20 containerships, one of which, the Argos, was contracted to be sold, which sale was completed in December 2018, which we refer to herein as the “Poseidon Transaction”. References herein to the “GSL Fleet” are to the 19 ships that were owned by us prior to the consummation of the Poseidon Transaction, and references to the “Poseidon Fleet” are to the 19 ships that we acquired as a result of the Poseidon Transaction, excluding the Argos. On the closing of the Poseidon Transaction, we issued to the Poseidon unitholders 3,005,603 Class A common shares and 250,000 Series C Preferred Shares, which are convertible to an aggregate of 12,955,187 Class A common shares in certain circumstances, and assumed the debt of Poseidon Containers, which amounted to $509.7 million as of November 15, 2018.
1
Table of Contents
Following the announcement of the Poseidon Transaction on October 29, 2018, we have agreed multiple new charters in an improving market over multi-year durations, to renew or replace expiring charters, that have resulted in material improvements to key performance metrics, such as:
| • | Increased remaining contract duration: Since the announcement of the Poseidon Transaction, we have agreed to 27 new charters with an aggregate contract duration of 68 years, resulting in TEU-weighted average remaining contract duration for our entire fleet, as of June 30, 2019 and including subsequent announcements of new charters and options to extend which are under our control, and assuming the mid-point of the redelivery period, of 2.9 years, or 3.3 years also including options to extend which are under the charterers’ control and assuming the latest redelivery date. The charter-attached value of our fleet of 41 vessels as at June 30, 2019 was $1.34 billion. |
| • | Significant new contracted revenue: Since announcing the Poseidon Transaction, we have entered into charters, both as charter renewals and for ship acquisitions, which are expected to generate $511.9 million contracted revenue (measured over the term of the charter to the mid-point of redelivery including options to extend these new charters which are under our control). Contracted future revenue was $835.4 million, as of June 30, 2019 and including subsequent agreements of new charters (assuming the mid-point of redelivery under charters and including options to extend which are under our control). We estimate that our contracted revenue represents 99% of Adjusted EBITDA for 2019, 89% for 2020 and 76% for 2021 on the assumption that ships coming off charter are re-employed at 10 year historical average rates, less 5% commissions. |
In addition, in May 2019, we agreed to acquire three 2004-built 7,849 TEU containerships. Shortly after delivery in May 2019, the first ship, GSL Eleni, commenced a five-year charter with Maersk Line. The second ship, GSL Grania, was delivered in September 2019 and commenced a three-year charter with Maersk Line, with two consecutive one-year extensions at the charterer’s option. The remaining ship, GSL Kalliopi, is expected to be delivered in late September or early October 2019 and upon delivery is scheduled to commence a three-year charter with Maersk Line, with two consecutive one-year extensions at the charterer’s option.
As of the date of this prospectus, we owned 40 containerships and have agreed to acquire one further ship. Following the delivery of this ship, we will own 41 mid-sized and smaller containerships of which nine (representing 31% of our fleet by TEU capacity) are new-design, high-specification, fuel-efficient, and wide-beam. Our fleet, pro forma for the delivery of the remaining vessel we have agreed to acquire, has a total capacity of 224,162 TEU, making us the 13th largest non-operating owner of containerships as of June 30, 2019, according to MSI. Our fleet’s average size is 5,467 TEU, with a TEU weighted average age of 11.9 years.
All of our ships are chartered out on time charters, representing contracted future revenue of $835.4 million as of June 30, 2019, including subsequent new charters and options to extend which are under our control, and assuming the mid-point of redelivery, over a TEU-weighted average remaining term of 2.9 years. Contracted future revenue was $916.4 million on the same basis, but also including options to extend which are under the charterers’ control and assuming the latest redelivery date, over a TEU-weighted average remaining term of 3.3 years. By applying the Adjusted EBITDA Margin of 62.2% for the six months ended June 30, 2019 to contracted future revenue, this would imply Contracted Adjusted EBITDA of $519.6 million on our contracted future revenue of $835.4 million (to the mid-point of redelivery and including options to extend charters which are under our control) and $570.0 million on our future contracted revenue of $916.4 million (also including options to extend which are under the charterers’ control and assuming the latest redelivery). Adjusted EBITDA, Adjusted EBITDA Margin and Contracted Adjusted EBITDA are non-U.S. GAAP measures. For a description of Adjusted EBITDA, Adjusted EBITDA Margin and Contracted Adjusted EBITDA and a reconciliation of these measures to net income, the most directly comparable US GAAP financial measure, please see “Summary Financial Data—Non-U.S. GAAP Financial Measures” below.
2
Table of Contents
On January 2, 2019, as a consequence of the completion of the Poseidon Transaction, all of our issued and outstanding Class B common shares converted one-for-one into Class A common shares. On March 25, 2019, we effected a one-for-eight reverse stock split of our Class A common shares, which our shareholders authorized at our special meeting of shareholders held on March 20, 2019. There was no change to the trading symbol, number of authorized shares, or par value of our Class A common shares in connection with the reverse stock split. As of June 30, 2019, there were 9,942,950 Class A common shares issued and outstanding, along with 250,000 Series C Preferred Shares, which are convertible into 12,955,187 Class A common shares in certain circumstances. All share and per share amounts disclosed in this prospectus give effect to the reverse stock split retroactively, for all periods presented.
The mailing address of our principal executive office is c/o Global Ship Lease Services Limited, 25 Wilton Road, London SW1V 1LW, United Kingdom, and our telephone number is +44 (0) 20 3998 0063. Our website address is www.globalshiplease.com. The information included on our website is not incorporated herein by reference. From time to time, we may use our website and social media outlets as channels of distribution of material company information.
Industry Overview
The following is a summary of certain industry information provided by Maritime Strategies International Ltd. (“MSI”), which appears later in this prospectus under the heading “The International Container Shipping and Containership Leasing Industry.”
Containerization is the most convenient and cost-effective way to transport a wide range of cargoes, predominantly a diverse selection of consumer, manufactured, and semi-manufactured goods. Furthermore, emissions per ton-mile of cargo carried compare favorably to other existing modes of transport.
The first containerized cargoes were shipped in the mid-1950s; global containerized trade volumes for 2018 are estimated to be 208 million TEU. As at June 30, 2019, the global containership fleet stood at 5,165 ships, with an aggregate capacity of 22.3 million TEU; 54.0% of this capacity is provided to liner operators by containership owners like GSL.
Cargo volumes have grown every year since the industry’s inception – except 2009, during the Global Financial Crisis – with the growth in the containerized transport of refrigerated (“reefer”) cargo tending to outpace that of overall containerized trade. As at June 30, 2019, MSI forecasts that global containerized trade will grow by 2.8% in 2019 and 4.1% in 2020.
3
Table of Contents
Growth of Containerized Trade, Including 2019 and 2020 Forecasts

The containerized supply chain extends throughout the world. The Mainlane trades are those linking the major manufacturing economies in Asia with the major consumer economies in North America (Transpacific) and Europe (Asia-Europe), and the Transatlantic trade. However, over 70% of global containerized trade volumes are in the non-Mainlane trades, with intra-regional trades alone representing almost 39%. Indeed, the largest trade grouping – representing almost a third of global volumes – comprises the intra-Asian trades connecting that region’s rapidly growing markets. Non-Mainlane trades are predominantly served by mid-size and smaller containerships, like those in our fleet.
4
Table of Contents
Containership Deployment by Trade, as at June 30, 2019

The Transpacific trades represent 12.5% of overall volumes, while trade between China and the US (and vice-versa) represents 6.7% of global containerized volumes. One consequence of trade tensions between the US and China has been the increased market share of non-Chinese manufacturers on the Asia-US trade via a process of cargo substitution. Over the first six months of 2019, MSI estimates that US containerized imports from China and Hong Kong shrank by 5.3% (equal to a decrease of 290,000 TEU), while US imports from ASEAN countries grew by 23.0% (equal to an increase of 295,000 TEU), and imports from Japan, South Korea and Taiwan grew by 8.9% (equal to an increase of 93,000 TEU). We believe cargo substitution may stimulate additional demand for mid-size and smaller vessels in the intra-Asian trades.
The container shipping industry is both cyclical and seasonal. We believe that supply / demand fundamentals are currently strongly supportive, particularly for the mid-size and smaller ship sizes upon which GSL is focused. As of June 30, 2019, MSI estimates that idle capacity for the global fleet was only 1.5%, capacity scrapped during the first half of 2019 exceeded capacity scrapped in full year 2018, and the newbuilding orderbook – which is scheduled to deliver over the next two to three years – was limited, with an orderbook-to-fleet ratio of 11.2% (down from a peak of over 60% in 2007). For ships of 2,000 – 9,999 TEU (mid-size and smaller) the ratio was 2.6%, with no ships on order between 4,000 and 9,999 TEU – sizes representing over 80% of GSL fleet capacity. As of June 30, 2019, MSI estimates that the lead time from order to delivery of a new ship would be approximately two years.
5
Table of Contents
Estimated Capacity on Order by Segment, as at June 30, 2019

A combination of scrapping and under-investment in the sector has led to minimal, and in some cases net-negative, fleet growth in the mid-size and smaller ship fleet segments in recent years. As a result, these size segments are comparatively older than those for very large containerships, where recent investment has tended to be focused. Furthermore, we believe that consolidation and bankruptcies in the shipyard sector (MSI estimates that the number of active shipyards has decreased by 65% since 2007), together with a more coordinated approach from the liner operator alliances, is improving ordering discipline and reducing the risk of supply-side overshoot going forward.
6
Table of Contents
Net Fleet Growth by Segment, 2016 through June 30, 2019

We expect the implementation of industry-wide regulatory changes on emission controls starting January 1, 2020 (“IMO 2020”), which are expected to increase the unit cost of fuel due to the anticipated price premium of low Sulphur fuel, to further improve industry fundamentals as, among other things, operators reduce operating speeds as a cost control measure to reduce fuel consumption, thereby decreasing the effective supply of containerships. As at June 30, 2019, MSI estimates that slowing the global fleet by one knot would imply a reduction in effective supply of 6.7%.
IMO 2020 is also expected to increase the commercial appeal of fuel-efficient vessels which allow liner operators to reduce their operating costs per TEU of cargo carried (“slot costs”). The greater the cargo carrying capacity and fuel efficiency of a ship, the lower the slot costs. Latest generation “Eco” ships are significantly more fuel efficient than their pre-Eco peers, enhancing their earnings in the charter market. However, for mid-size and smaller ships, pre-Eco specification vessels are still the standard: as at June 30, 2019, MSI estimates that pre-Eco ships represented between 77% and 91% of capacity for the size segments below 7,500 TEU, and 58% for the 7,500 – 9,999 TEU segment.
We believe that firming rates in the charter market, particularly for larger mid-size (Post Panamax) ships, evidence strengthening industry fundamentals. An additional positive catalyst is ships being taken out of service for retro-fitting with exhaust gas scrubbers (an alternate means of complying with IMO 2020). MSI estimates that 1.1% of the global containership fleet (by number of vessels) had been scrubber-fitted by June 30, 2019, and forecasts that around 15.0% of containerships will ultimately be fitted with exhaust gas cleaning technology.
Charter rates for 6,500 TEU and 8,500 TEU ships have more than doubled since the end of 2018.
7
Table of Contents
Asset Value and Spot Market Time Charter Rate Development, September 1, 2016 through June 30, 2019

Panamax and Post-Panamax Time charter Earnings Developments since Q4 2018

8
Table of Contents
We believe that the fuel-efficient, low slot characteristics of our ships will allow us to capitalize on the trends described above, enhancing the earnings capacity and value of the GSL fleet over time.
Our Competitive Strengths.
We believe that we possess a number of competitive strengths that differentiate us and will allow us to capitalize on opportunities in the containership sector, including:
Experienced Management Team. Members of our management team, board of directors and Managers have extensive experience in the container shipping industry and have long-term relationships with companies, individuals and institutions within the wider shipping industry. Our Executive Chairman, George Giouroukos, has more than 25 years of leadership and shipping industry experience, while our Chief Executive Officer, Ian Webber, has 30 years of shipping industry experience, 12 of which serving as our Chief Executive Officer. We believe that we will be able to capitalize on the experience and relationships of our management, board of directors and Managers to identify future acquisitions and charter opportunities beyond those widely and publicly marketed, expand our customer base, and finance these acquisitions and refinance our debt. See “Item 6. Directors, Senior Management and Employees” in our 2018 Annual Report, which is incorporated herein by reference.
Significant Contracted Revenue. All of our ships are chartered out on time charters, representing contracted future revenue of $835.4 million as of June 30, 2019, including subsequent new charters and options to extend which are under our control, and assuming the mid-point of redelivery, over a TEU-weighted average remaining term of 2.9 years. Contracted future revenue was $916.4 million on the same basis, but also including options to extend which are under the charterers’ control and assuming the latest redelivery date, over a TEU-weighted average remaining term of 3.3 years. Our contracted revenue mostly consists of revenue generated by our larger ships as these have higher daily charter rates and longer charter durations provides substantial forward visibility on earnings. Our smaller, lower-earning ships are mostly employed on shorter term contracts, which we believe will provide upside earnings potential in what we anticipate will be a firming charter market after a protracted downturn. Since announcing the Poseidon Transaction, we have entered into charters, both as charter renewals and for ship acquisitions, which are expected to generate $511.9 million contracted revenue (measured over the term of the charter to the mid-point of redelivery including options to extend these new charters which are under our control).
Diversified Portfolio of Charterers. As of June 30, 2019, charterers of our ships included Maersk Line, MSC, COSCO-OOCL, CMA CGM, Hapag-Lloyd and ZIM. In addition, our Commercial Manager has established relationships with, and has previously arranged charters with, many other reputable liner operators, such as ONE, Wan Hai, Evergreen and Seaboard Marine. We expect to continue to capitalize on our senior management’s and Commercial Manager’s long-standing relationships with leading liner companies. We believe that the experience of our senior management team, coupled with our Technical Manager’s extensive experience and reputation, will continue to assist us in securing high employment coverage for our ships to facilitate our future growth.
Focused Fleet Composition. Our fleet is focused on high specification, mid-sized and smaller ships, which we believe are undersupplied in the market and have multiple deployment opportunities. We own and operate 41 containerships, including the ship that will be delivered to us in late September or early October 2019, ranging in size between 2,207 TEU and 11,040 TEU, built at reputable shipyards, with high specifications, and which are well-maintained. Such mid-size and smaller ships are operationally flexible and are core to servicing multiple non-arterial, intermediate, and intra-regional container trades which, in aggregate, represented over 70% of global containerized trade volumes in 2018. Limited investment by the industry in recent years in mid-sized and smaller containerships has resulted in a small orderbook to be delivered over the next two-three years (the
9
Table of Contents
orderbook to fleet ratio for 2,000—10,000 TEU ships was 2.6% as of June 30, 2019, versus an overall ratio of 11.2%) and an aging global fleet, with limited availability of latest-generation ships in these segments.
Fleet with High Technical Specifications. Value-adding attributes that render our ships attractive to our customers, the liner operators, include capacity to carry a large number of temperature-controlled containers (“reefers”), wide-beam and fuel-efficient designs, and onboard cranes (“gear”) for cargo handling. We believe that these features enable our fleet to achieve higher levels of employment and earnings against ships with lower specifications. 72% of our fleet capacity is made up of Post-Panamax containerships larger than 5,500 TEU, which provide enhanced ship stability and thus greater cargo carrying capacity. Cargo carrying capacity is an important selection criterion for liner operators as it reduces slot cost, which is calculated for any given ship as daily fuel cost plus daily charter hire divided by standardized loadable capacity. Nine of our Post-Panamax ships are also latest-generation, fuel efficient “Eco” ships, which further enhance slot cost economics for liner operators and command an earnings premium in the charter market versus non-Eco ships and have the potential to provide longer term charters. Fuel efficiency becomes even more valuable as fuel prices rise, as is anticipated with the introduction of industry-wide emission control regulations from January 2020 (“IMO 2020”), with which the vast majority of ships will comply by burning higher cost, low sulfur fuel. Furthermore, we believe there is a clear correlation between low slot costs and low emissions per TEU, favoring our low slow cost fleet.
Capitalize on Cascade. The shipping industry up-sizes ships over time in order to capture economies of scale by increasing the carrying capacity of ships. This up-sizing is also referred to as the “cascade,” and involves larger ships progressively displacing smaller ships into other trade lanes. Non-mainlane, intermediate, and intra-regional trades are of fundamental importance to global containerized trade—representing, in aggregate, over 70% of global containerized trade volumes in 2018—and are predominantly served by mid-size and smaller ships, which we believe are supply-constrained. We also believe that our fuel-efficient, low slot cost ships position us to capitalize on cascading opportunities in these markets. As of June 30, 2019, according to MSI, 42.0% of the global fleet (by number of ships) was comprised of ships of 2,000 TEU or smaller, providing significant cascading opportunities for even the smallest ships in our fleet (2,200 TEU).
Efficient Ship Operations. We believe that our Technical Manager’s experience in the technical management of containerships, and their reputation in the shipping industry as operators with high safety and operating standards, are important in servicing our charterers, who depend on reliable ships and responsible containership owning companies to meet their exact and demanding ship scheduling requirements. Our Technical Manager has been managing ships successfully since 1994 and this depth of experience not only provides our customers with a high level of service quality and confidence but also gives us competitive average daily operating costs. Despite significant drydocking of our ships for regulatory surveys and upgrades, utilization for the six months ended June 30, 2019 was 96.9%. Utilization for the three months ended March 31, 2019, which was not affected by elevated levels of drydocking, was 99.8%. In addition, our Technical Manager has experience in upgrading ships, including reefer capacity and fuel efficiency and in the efficient design of scrubbers, all of which raise our ships to higher commercial standards enhancing their marketability and earning capacity.
Growth Track Record. We have a proven ability to grow by purchasing ships with pre-agreed charters that are immediately accretive to cashflow and earnings, while concurrently putting in place competitively-priced and conservatively-structured debt to facilitate such growth. Our Executive Chairman, George Giouroukos, has structured and concluded over 250 secondhand and newbuilding ship transactions. The strategic combination between GSL and Poseidon Containers in November 2018 also demonstrates our capacity to successfully execute transformative corporate transactions. We believe that our senior management team’s extensive knowledge of, and contacts within, the container shipping industry will allow us to continue to add value-accretive ships and charters to our portfolio.
10
Table of Contents
Multiple Financing Sources. Access to cost-effective capital is important in the container shipping industry. As a publicly listed company with a business model primarily oriented towards providing medium-term charters to reputable counterparties, we can potentially access equity and debt markets, both private and public, on a recurrent basis. In a capital-constrained environment, we believe that being a publicly listed company with a high level of transparency and reporting is an advantage in competing with other containership owning companies, which are predominantly private and do not have access to such diverse sources of capital. In addition, our management team has extensive and long-standing relationships with commercial banks that provide us with access to the traditional secured loan bank market. Specifically, since the Poseidon Transaction, our significantly expanded banking relationships now include Citi, Credit Agricole, Deutsche Bank, ABN Amro, DVB, CIT, Entrust, ATB, Hellenic Bank and Siemens, most of which participated in our new syndicated $268.0 million senior secured credit facility.
Our Business Strategies
Our primary objective is to maximize value for our shareholders by pursuing the following strategies:
Maintain Fleet Focus. We intend to maintain our focus on containerships of 2,000 – 11,000 TEU, weighted towards wide-beam, high-reefer, fuel-efficient ships of 5,500 – 10,000 TEU. We believe the cost-return characteristics of ships in this size segment are attractive. Specifically, they are sought after by charterers given their operational flexibility and low slot costs and should thereby allow us to manage our fleet deployment effectively, locking in upside earnings potential for shareholders by securing longer-term charters generating contracted cashflows. Furthermore, due to scarce capital being disproportionately allocated to the construction of the largest containerships for the main East-West trades lanes, such as Asia – Europe, the order-book for containerships below 10,000 TEU is at historically low levels and, according to MSI, there are no ships on order in our area of focus, the 4,000 TEU and 9,999 TEU segment, which, combined with reasonable demand growth for container shipping services, particularly in the trade lanes where our ships are best deployed, is expected to result in continuing improvements in charter rates and hence asset values, over time. We expect supply to tighten further for these ship segments with the implementation on January 1, 2020 of the new industry-wide emission controls under IMO 2020, which we believe may prompt liner operators to slow down their ships in order to reduce fuel burn and thus cost, reducing effective supply.
Optimize Charter Portfolio. We intend to proactively manage our portfolio of charters to lock in upside earning potential, while also providing downside protection through charter cover. This provides significant forward visibility of stable cashflows, while preserving the flexibility to capitalize on potentially rising charter rates. We currently charter most of our high revenue producing ships under medium term time charters of between three to five years, with staggered maturities, while the remainder of the fleet, mostly our smaller ships, are on shorter term charters of less than 12 months to position us to benefit from market increases in charter rates. Additionally, we will continue to charter our ships to reputable charterers, such as our long-standing clients Maersk Line, MSC, COSCO-OOCL, CMA CGM, Hapag Lloyd and ZIM, and will continue to expand the number of leading liner companies chartering our ships in order to further diversify our portfolio of charters from customer, geographic and maturity perspectives.
Moderate Leverage Level and Reduced Cost of Debt. Our mandatory debt repayment profile will result in substantial debt reduction over the next few years. We believe that reducing our leverage and maintaining debt at a moderate level will enable us to reduce our overall cost of debt, enhance our financial flexibility and allow us to make opportunistic acquisitions consistent with our strategy. We expect to finance future ship acquisitions, with cash on hand, borrowings under new credit facilities, or subject to favorable market conditions, public debt or equity offerings, or a combination thereof.
Implement Disciplined Growth. We intend to continue to grow and renew our fleet mainly by acquiring second-hand containerships with high specifications and fuel efficiency, that are already employed on charters or
11
Table of Contents
that can be so employed immediately following their acquisition, as market conditions allow. When evaluating these future acquisitions, we will consider, among other things, fundamental developments in the container shipping industry, the value of the ship compared to historical levels, the cash flow expected to be earned by the ship in relation to its value, the credit quality of the charterer and duration and terms of charter contracts, its condition and technical specifications, as well as the overall diversification of our fleet and customer portfolio. We believe that attractive, counter-cyclical investment opportunities are available in the market. These may include both structured sale and leaseback transactions with liner companies and the acquisition of selected, attractively-priced ships, in the sale and purchase market. In addition, we will evaluate and consider strategic corporate acquisitions on a selective and prudent basis.
Leverage Our Managers’ Experience. We intend to leverage our Technical Manager’s expertise to continue to manage our ships efficiently and reliably at a low daily operating cost, as well as support future growth. We believe that our Technical Manager is able to oversee the technical management of our fleet at a cost than is lower than we could achieve in-house and which is competitive compared to other independent ship management companies. Additionally, we believe that our outsourced management arrangements provide scalability to facilitate growth without the incurrence of significant additional overheads. In addition, our Technical Manager has experience in upgrading the reefer capacity and fuel efficiency of ships, and in the efficient design of scrubbers, as well as other characteristics that raise our ships to higher commercial standards enhancing their marketability and earning capacity. Moreover, our Commercial Manager has direct relationships with liner companies as evidenced by multiple long-term contracts, including repeat business, secured since the completion of the Poseidon Transaction.
12
Table of Contents
Our Fleet
The table below provides information about our fleet of 41 containerships as of September 16, 2019:
| Ship Name | Capacity in TEUs |
Lightweight (tons) |
Year Built |
Charterer | Earliest Charter |
Latest Charter |
Daily Charter Rate $ |
|||||||||||||||||||
| CMA CGM Thalassa |
11,040 | 38,577 | 2008 | CMA CGM | 4Q25 | 1Q26 | 47,200 | |||||||||||||||||||
| UASC Al Khor(1) |
9,115 | 31,764 | 2015 | Hapag-Lloyd | 1Q22 | 2Q22 | 34,000 | |||||||||||||||||||
| Anthea Y(1) |
9,115 | 31,890 | 2015 | COSCO | 2Q20 | 3Q20 | 39,200 | |||||||||||||||||||
| Maira XL(1) |
9,115 | 31,820 | 2015 | COSCO | 2Q20 | 3Q20 | 39,200 | |||||||||||||||||||
| MSC Tianjin |
8,667 | 34,243 | 2005 | MSC | 2Q24 | 3Q24 | (2) | — | (2) | |||||||||||||||||
| MSC Qingdao |
8,667 | 34,305 | 2004 | MSC | 2Q24 | 3Q24 | (2) | — | (2) | |||||||||||||||||
| GSL Ningbo |
8,667 | 34,243 | 2004 | Maersk | 3Q20 | 3Q20 | 12,400 | (3) | ||||||||||||||||||
| GSL Kalliopi |
7,849 | 29,245 | 2004 | Maersk | 3Q22 | 4Q24 | (4) | — | (4) | |||||||||||||||||
| GSL Grania |
7,849 | 29,261 | 2004 | Maersk | 3Q22 | 4Q24 | (4) | — | (4) | |||||||||||||||||
| GSL Eleni |
7,849 | 29,261 | 2004 | Maersk | 2Q24 | 3Q24 | (4) | — | (4) | |||||||||||||||||
| Mary(1) |
6,927 | 23,424 | 2013 | CMA CGM | 3Q23 | 4Q23 | 25,910 | |||||||||||||||||||
| Kristina(1) |
6,927 | 23,424 | 2013 | CMA CGM | 2Q24 | 3Q24 | 25,910 | |||||||||||||||||||
| Katherine(1) |
6,927 | 23,424 | 2013 | CMA CGM | 1Q24 | 2Q24 | 25,910 | |||||||||||||||||||
| Alexandra(1) |
6,927 | 23,424 | 2013 | CMA CGM | 1Q24 | 2Q24 | 25,910 | |||||||||||||||||||
| Alexis(1) |
6,882 | 23,919 | 2015 | CMA CGM | 1Q24 | 2Q24 | 25,910 | |||||||||||||||||||
| Olivia I(1) |
6,882 | 23,864 | 2015 | CMA CGM | 1Q24 | 2Q24 | 25,910 | |||||||||||||||||||
| CMA CGM Berlioz |
6,621 | 26,776 | 2001 | CMA CGM | 2Q21 | 4Q21 | 34,000 | |||||||||||||||||||
| Agios Dimitrios |
6,572 | 24,746 | 2011 | MSC | 3Q19 | 4Q23 | 12,500 | (5) | ||||||||||||||||||
| Tasman |
5,936 | 25,010 | 2000 | ZIM | 3Q19 | 3Q19 | (6) | 11,500 | (6) | |||||||||||||||||
| Dimitris Y |
5,936 | 25,010 | 2000 | ZIM | 3Q19 | 3Q19 | (7) | 16,750 | (7) | |||||||||||||||||
| Ian H |
5,936 | 25,128 | 2000 | ZIM | 1Q21 | 2Q21 | 14,500 | |||||||||||||||||||
| Dolphin II |
5,095 | 20,596 | 2007 | HMM | 3Q19 | (8) | 4Q19 | (8) | 7,700 | (8) | ||||||||||||||||
| Orca I |
5,095 | 20,696 | 2006 | Maersk | 2Q20 | (9) | 2Q21 | (9) | 9,000 | (9) | ||||||||||||||||
| CMA CGM Alcazar |
5,089 | 20,087 | 2007 | CMA CGM | 4Q20 | 2Q21 | 33,750 | |||||||||||||||||||
| CMA CGM Château d’If |
5,089 | 20,100 | 2007 | CMA CGM | 4Q20 | 2Q21 | 33,750 | |||||||||||||||||||
| CMA CGM Jamaica |
4,298 | 17,272 | 2006 | CMA CGM | 3Q22 | 1Q23 | 25,350 | |||||||||||||||||||
| CMA CGM Sambhar |
4,045 | 17,355 | 2006 | CMA CGM | 3Q22 | 1Q23 | 25,350 | |||||||||||||||||||
| CMA CGM America |
4,045 | 17,355 | 2006 | CMA CGM | 3Q22 | 1Q23 | 25,350 | |||||||||||||||||||
| GSL Valerie |
2,824 | 11,971 | 2005 | MSC | 2Q20 | 3Q20 | 9,000 | |||||||||||||||||||
| Athena |
2,762 | 13,538 | 2003 | MSC | 1Q20 | 2Q20 | 9,000 | |||||||||||||||||||
| Maira |
2,506 | 11,453 | 2000 | MSC | 3Q19 | 3Q19 | 8,500 | (10) | ||||||||||||||||||
| Nikolas |
2,506 | 11,370 | 2000 | MSC | 1Q20 | 1Q20 | 9,000 | |||||||||||||||||||
| Newyorker |
2,506 | 11,463 | 2001 | MSC | 1Q20 | 1Q20 | 9,000 | |||||||||||||||||||
| CMA CGM La Tour |
2,272 | 11,742 | 2001 | CMA CGM | 4Q19 | 4Q19 | 15,300 | |||||||||||||||||||
| CMA CGM Manet |
2,272 | 11,742 | 2001 | CMA CGM | 4Q19 | 4Q19 | 15,300 | |||||||||||||||||||
| CMA CGM Matisse |
2,262 | 11,676 | 1999 | CMA CGM | 4Q19 | 4Q19 | 15,300 | |||||||||||||||||||
| CMA CGM Utrillo |
2,262 | 11,676 | 1999 | CMA CGM | 3Q19 | 3Q19 | 15,300 | (11) | ||||||||||||||||||
| GSL Keta |
2,207 | 11,731 | 2003 | ANL | 3Q19 | 3Q19 | 8,450 | (12) | ||||||||||||||||||
| GSL Julie |
2,207 | 11,731 | 2002 | CMA CGM | 3Q19 | 4Q19 | 7,200 | (13) | ||||||||||||||||||
| Kumasi |
2,207 | 11,731 | 2002 | CMA CGM | 4Q19 | 1Q21 | (14) | 9,800 | (14) | |||||||||||||||||
| Marie Delmas |
2,207 | 11,731 | 2002 | CMA CGM | 4Q19 | 1Q21 | (14) | 9,800 | (14) | |||||||||||||||||
| (1) | Modern design, high reefer capacity fuel efficient ships. |
| (2) | Five year charter to MSC at implied Adjusted EBITDA of $25.6 million per ship for the period. |
| (3) | Charterer has exercised its option to extend by 12 months from September 21, 2019 at $18,000 per day. |
13
Table of Contents
| (4) | GSL Eleni delivered in May 2019; GSL Grania delivered in September 2019 and GSL Kalliopi is scheduled to be delivered in late September or early October 2019. GSL Eleni chartered for five years; GSL Grania and GSL Kalliopi are or will be chartered for three years plus two successive periods of one year at option of the charterer. Implied Aggregate Adjusted EBITDA of $32.0 million for firm periods, increasing to $47.0 million if all options are exercised. |
| (5) | Thereafter, we have the option, callable in 4Q19, to extend for four years at $20,000 per day. |
| (6) | Thereafter, a new charter with Maersk Line for 30 – 38 months at an implied Adjusted EBITDA of $5.3 million for the median period. Additional 12 – month extension at charterer’s option, for an additional $4.4 million implied Adjusted EBITDA. |
| (7) | Thereafter in direct continuation, 21-24 months to ZIM at $14,500 per day. |
| (8) | Rate increases to $11,500 per day from August 14, 2019. |
| (9) | Rate increases to $10,000 per day from June 3, 2020. |
| (10) | Thereafter, 6-7 months to MSC at $8,250 per day. |
| (11) | Thereafter, 6-7 months to CMA CGM at $8,500 per day. |
| (12) | Thereafter 50 – 90 days to OOCL at $8,700 per day. |
| (13) | $ 7,200 per day between August 16, 2019 and October 16, 2019, at charterer’s option, with an option in favor of charterer to extend from October 16, 2019 at $8,500 per day for six months plus or minus 30 days. |
| (14) | We have the option to extend to December 31, 2020 plus or minus 90 days, at $9,800 per day. |
Employment of Our Fleet
We employ the ships in our fleet on time charters. A time charter is a contract for the use of a ship for a fixed period of time at a specified daily rate. Under a time charter, the ship owner provides and bears the cost of crew, lubricating oil and all maintenance and other services related to the ship’s operation, the cost of which is recovered from the daily charter rate. We are also responsible for insuring our interests in the ship and liabilities as owner arising from its use. The charterer is responsible for substantially all of the ship’s voyage costs, such as fuel (bunker) costs, canal fees, port expenses, cargo handling costs and extra war risk insurance costs if the ship is deployed outside normal insurance limits and enters areas which are specified by the insurance underwriters as being subject to additional premiums.
The term for a time charter commences on the ship’s delivery to the charterer. Time charter agreements may include options, in favor of the owner or the charterer, to extend the charter on pre-agreed terms. Charters may be extended on mutually agreed terms, or the ship may be re-delivered by the charterer at the end of the charter period, within a pre-agreed time window (to allow for operational flexibility), in which case we would seek alternate employment with another charterer.
Our charters are with a number of different charterers and expire on different dates over a period of time. We believe the diversified charterer base reduces counterparty risk and the staggered expirations of our charters reduces our exposure to re-chartering risk and may mitigate the impact of the cyclical nature of the container shipping industry.
Management of our Ships
Technomar provides day-to-day technical ship management services for all of our ships.
Global Ship Lease Services Limited (“GSLS”), our wholly owned subsidiary, is the commercial manager for 18 of our ships. It has entered into a Commercial Advisory Services and Exclusive Brokerage Services Agreement (“EBSA”) with Conchart, whereby Conchart is appointed to provide commercial advisory and exclusive brokerage services. The remaining 23 ships in our fleet are or will be subject to a commercial management agreement directly with Conchart, on terms substantially similar to those of the EBSA.
14
Table of Contents
For more information regarding management of our ships, please see “Item 4. Information on the Company-B. Business Overview-Ship Management” in our 2018 Annual Report, which is incorporated herein by reference.
Risk Factors
We face a number of risks associated with our business and shipping industry and must overcome a variety of challenges to utilize our strengths and implement our business strategies. These risks relate to, among others, changes in the shipping industry, including supply and demand, charter rates, ship values, a downturn in the global economy, operational hazards inherent in container shipping industry and operations resulting in liability for damage to or destruction of property and equipment, pollution or environmental damage, inability to comply with covenants in our current indebtedness and borrowings we may enter into in the future, inability to finance capital projects, and inability to successfully employ our ships at the expiration of current charters.
You should carefully consider these risks, the risks described in “Risk Factors” and the other information in this prospectus and our most recent Annual Report on Form 20-F before deciding whether to invest in our Class A common shares.
Recent Developments
In May 2019, we agreed to acquire three 2004-built 7,849 TEU containerships. Shortly after delivery in May 2019, the first ship, GSL Eleni, commenced a five-year charter with Maersk Line. The second ship, GSL Grania, was delivered in September 2019 and commenced a three-year charter with Maersk Line, with two consecutive one-year extensions at the charterer’s option. The remaining ship, GSL Kalliopi, is expected to be delivered in late September or early October 2019 and is scheduled to commence a three-year charter with Maersk Line, with two consecutive one-year extensions at the charterer’s option.
In July 2019, GSL Keta, a 2003-built, 2,207 TEU containership, commenced a new charter with OOCL for minimum 50 days / maximum 90 days at a fixed rate of $8,700 per day. The charterer of GSL Ningbo, a 2004-built, 8,667 TEU containership, has exercised its option to extend the vessel’s charter for 12 months at a fixed rate of $18,000 per day starting from September 21, 2019.
At our 2019 Annual Meeting of Shareholders held on August 8, 2019, our shareholders approved the re-election of Messrs. Michael Chalkias and George Giouroukos, Term II Directors, to serve until our 2022 Annual Meeting of Shareholders, and ratified the appointment of PricewaterhouseCoopers S.A. as our independent public accounting firm for the fiscal year ending December 31, 2019.
In August 2019, Maersk exercised its option to extend the charter on GSL Ningbo by 12 months, commencing September 21, 2019, at an increased rate of $18,000 per day.
In August 2019, CMA CGM exercised its option to extend the charter on GSL Julie by six months, commencing October 16, 2019, at an increased rate of $8,500 per day and agreed to extend the charter of CMA CGM Utrillo by six-seven months, commencing September 16, 2019, at a rate of $8,500 per day.
In August 2019, MSC agreed to extend the charter of Maira by six-seven months, commencing September 17, 2019, at a rate of $8,250 per day.
In September 2019, we entered into a new syndicated $268.0 million senior secured credit facility comprised of two tranches (the “New Senior Loan”) with major commercial lenders Crédit Agricole, ABN AMRO, CIT, Hellenic Bank and Siemens. The first tranche of the New Senior Loan of $230.0 million was drawn
15
Table of Contents
down, in full, on September 23, 2019 and the proceeds will be used very shortly to refinance five of our existing senior credit facilities with maturities in December 2020 and April 2021 (the “First Tranche Refinancing”). As a result of the First Tranche Refinancing, three 2000-built 6,000 TEU ships, Tasman, Dimitris Y and Ian H, will become unencumbered. The second tranche of up to $38.0 million is available to us on similar terms until May 2020 to facilitate further refinancing. The final maturity date of the New Senior Loan is September 2024, five years after drawdown. Borrowings under the New Senior Loan bear interest at LIBOR plus a margin of 3.0% and the scheduled amortization is $5.2 million per quarter.
In September 2019, we also refinanced all of the existing indebtedness under our Junior Facility in the amount of $38.5 million (the “New Junior Facility”), with the only change being to extend its maturity from September 2023 to September 2024, consistent with the maturity date of the New Senior Loan. The other terms of the New Junior Facility remain consistent with the original Junior Facility, bearing interest at 10.0% and repayable in one balloon payment upon maturity.
In September 2019, we entered into an agreement with Kelso, whereby Kelso agreed to convert its outstanding Series C Preferred Shares into Class A common shares upon the repayment in full of our 9.875% First Priority Secured Notes due 2022.
We were incorporated in the Republic of the Marshall Islands on March 14, 2008 as GSL Holdings Inc.
On August 14, 2008, we merged with Marathon Acquisition Corp., a company then listed on The American Stock Exchange, and with the pre-existing Global Ship Lease, Inc., which was then wholly owned by CMA CGM. GSL Holdings, Inc. was the surviving entity, changed its name to Global Ship Lease, Inc. and became listed on The New York Stock Exchange (the “NYSE”).
The mailing address of our principal executive office is c/o Global Ship Lease Services Limited, 25 Wilton Road, London SW1V 1LW, United Kingdom, and our telephone number is +44 (0) 20 3998 0063.
We are incorporated under the laws of the Republic of the Marshall Islands, and as a consequence, you may encounter difficulty protecting your interests as shareholders, and your ability to protect your rights through the U.S. federal court system may be limited. Please refer to the sections entitled “Risk Factors” and “Enforcement of Civil Liabilities” for more information.
16
Table of Contents
| Class A Common shares offered |
6,620,686 Class A common shares. |
| Over-allotment |
We have granted the underwriter a 30-day option to purchase up to an additional 993,102 of our Class A common shares. |
| Class A Common shares outstanding immediately after the offering(1) |
16,563,636 Class A common shares. |
| 17,556,738 Class A common shares, if the underwriter exercises its option to purchase additional shares in full. |
| Use of proceeds |
We estimate that we will receive net proceeds of approximately $44.6 million from this offering assuming the underwriters’ over-allotment option is not exercised, and approximately $51.3 million if the underwriters’ option is exercised in full, in each case after deducting underwriting discounts and commissions and estimated expenses payable by us. |
| We intend to use the net proceeds of this offering for general corporate purposes, which may include, among other things, the acquisition of containerships in accordance with our growth strategy, or prepaying debt. However, we do not currently have definitive plans for any debt prepayments nor have we identified any potential acquisitions, and we can provide no assurance that we will be able to complete any debt prepayment or the acquisition of any vessel that we are able to identify. |
| Please read “Use of Proceeds.” |
| Listing |
Our Class A common shares are currently listed on the New York Stock Exchange under the symbol “GSL.” |
| Transfer agent |
Computershare Trust Company, N.A. |
| Risk factors |
Investment in our Class A common shares involves a high degree of risk. You should carefully read and consider the information set forth under the heading “Risk Factors” and all other information set forth in this prospectus before investing in our Class A common shares. |
| (1) | The number of Class A common shares outstanding immediately after the offering is based on Class A common shares outstanding as of September 26, 2019. |
17
Table of Contents
The following table sets forth summary consolidated financial and other data of the Company for the years ended December 31, 2018, 2017 and 2016 and as of December 31, 2018 and 2017 which is derived from our audited consolidated financial statements included in our annual report on Form 20-F for the year ended December 31, 2018, filed with the SEC on March 29, 2019, incorporated by reference herein. The summary consolidated financial and other data of the Company as of December 31, 2016, 2015 and 2014 and for the years ended December 31, 2015 and 2014, is derived from our audited consolidated financial statements not incorporated by reference herein but publicly available at www.sec.gov. The table also sets forth summary consolidated financial and other data of the Company as of June 30, 2019 and 2018 and for the six month periods ended June 30, 2019 and 2018 which is derived from our unaudited consolidated financial statements and the notes thereto, included in our Report on Form 6-K that was filed with the SEC on August 9, 2019, which is incorporated by reference herein.
The summary financial data set forth below should be read in conjunction with, and are qualified in their entirety by reference to, (i) our audited consolidated financial statements, including the related notes thereto, and “Item 5. Operating and Financial Review and Prospects,” as presented in our 2018 Annual Report, incorporated by reference herein, and (ii) our interim unaudited consolidated financial statements and “Management’s Discussion and Analysis of Financial Condition and Results of Operations” as presented in our Report on Form 6-K, filed with the Commission on August 9, 2019, incorporated by reference herein. The summary historical financial information provided below does not purport to indicate results of operations as of any future date or for any future period.
CONSOLIDATED FINANCIAL DATA
| Six months ended June 30, |
Year ended December 31, | |||||||||||||||||||||||||||
| Summary Consolidated Statements of Income Data: | 2019 | 2018 | 2018 | 2017 | 2016 | 2015 | 2014 | |||||||||||||||||||||
| (Expressed in millions of U.S. dollars, except for per share data) | ||||||||||||||||||||||||||||
| Statements of Income |
||||||||||||||||||||||||||||
| Operating revenues: |
||||||||||||||||||||||||||||
| Time charter revenue |
$ | 127.6 | $ | 71.2 | $ | 157.1 | $ | 159.3 | $ | 166.8 | $ | 165.3 | $ | 138.7 | ||||||||||||||
| Operating expenses: |
||||||||||||||||||||||||||||
| Vessel operating expenses |
(41.8 | ) | (20.4 | ) | (49.3 | ) | (42.7 | ) | (45.4 | ) | (48.9 | ) | (47.6 | ) | ||||||||||||||
| Time charter and voyage expenses |
(3.6 | ) | (0.4 | ) | (1.6 | ) | (1.0 | ) | (0.7 | ) | (1.6 | ) | (1.3 | ) | ||||||||||||||
| Depreciation and amortization |
(21.7 | ) | (16.3 | ) | (35.5 | ) | (38.0 | ) | (42.8 | ) | (44.9 | ) | (41.1 | ) | ||||||||||||||
| Impairment of vessels |
— | — | (71.8 | ) | (87.6 | ) | (92.4 | ) | (44.7 | ) | — | |||||||||||||||||
| General and administrative expenses |
(4.1 | ) | (3.4 | ) | (9.2 | ) | (5.4 | ) | (6.2 | ) | (6.5 | ) | (7.0 | ) | ||||||||||||||
| Total operating expenses |
(71.2 | ) | (40.5 | ) | (167.4 | ) | (174.7 | ) | (187.5 | ) | (146.6 | ) | (97.0 | ) | ||||||||||||||
| Operating income (loss) |
56.4 | 30.7 | (10.3 | ) | (15.4 | ) | (20.7 | ) | 18.7 | 41.7 | ||||||||||||||||||
| Non-operating income (expense) |
||||||||||||||||||||||||||||
| Interest income |
0.8 | 0.6 | 1.4 | 0.5 | 0.2 | 0.1 | 0.1 | |||||||||||||||||||||
| Interest and other finance expenses |
(38.1 | ) | (21.5 | ) | (48.7 | ) | (59.4 | ) | (44.8 | ) | (48.2 | ) | (43.9 | ) | ||||||||||||||
| Gain on redemption of Series A Preferred Shares |
— | — | — | — | — | — | 8.6 | |||||||||||||||||||||
| Realized loss on interest rate derivative |
— | — | — | — | — | — | (2.8 | ) | ||||||||||||||||||||
| Unrealized gain on interest rate derivative |
— | — | — | — | — | — | 1.9 | |||||||||||||||||||||
| Other income, net |
1.2 | — | 0.3 | 0.1 | 0.2 | 0.6 | 0.6 | |||||||||||||||||||||
| Income (loss) before income taxes |
20.3 | 9.8 | (57.3 | ) | (74.2 | ) | (65.1 | ) | (28.8 | ) | 6.2 | |||||||||||||||||
| Income taxes |
— | (0.1 | ) | — | — | — | — | (0.1 | ) | |||||||||||||||||||
18
Table of Contents
| Six months ended June 30, |
Year ended December 31, | |||||||||||||||||||||||||||
| Summary Consolidated Statements of Income Data: | 2019 | 2018 | 2018 | 2017 | 2016 | 2015 | 2014 | |||||||||||||||||||||
| (Expressed in millions of U.S. dollars, except for per share data) | ||||||||||||||||||||||||||||
| Net income (loss) |
20.3 | 9.7 | (57.3 | ) | (74.2 | ) | (65.1 | ) | (28.8 | ) | 6.1 | |||||||||||||||||
| Earnings allocated to Series B Preferred Shares |
(1.5 | ) | (1.5 | ) | (3.1 | ) | (3.1 | ) | (3.1 | ) | (3.1 | ) | (1.1 | ) | ||||||||||||||
| Net income (loss) available to common shareholders |
18.8 | 8.2 | (60.4 | ) | (77.3 | ) | (68.2 | ) | (31.9 | ) | 5.0 | |||||||||||||||||
| Net income (loss) per Class A common share, in $ |
||||||||||||||||||||||||||||
| Basic and diluted |
0.82 | 1.36 | (7.42 | ) | (12.89 | ) | (11.39 | ) | (5.36 | ) | 0.8 | |||||||||||||||||
| Weighted average number of Class A common shares outstanding |
||||||||||||||||||||||||||||
| Basic and diluted in millions |
9.94 | 6.0 | 6.5 | 6.0 | 6.0 | 6.0 | 6.0 | |||||||||||||||||||||
| Net income per Class B common share, in $ |
||||||||||||||||||||||||||||
| Basic and diluted |
Nil | Nil | Nil | Nil | Nil | Nil | Nil | |||||||||||||||||||||
| Weighted average number of Class B common shares outstanding |
||||||||||||||||||||||||||||
| Basic and diluted in millions |
Nil | 0.9 | 0.9 | 0.9 | 0.9 | 0.9 | 0.9 | |||||||||||||||||||||
| Dividend per Class A common share in $ |
— | — | — | — | — | 0.02 | — | |||||||||||||||||||||
| Weighted average number of Class C preferred shares outstanding |
||||||||||||||||||||||||||||
| Basic and diluted in millions |
13.0 | Nil | 1.6 | Nil | Nil | Nil | Nil | |||||||||||||||||||||
| Net income (loss) per Class C preferred share, in $ |
||||||||||||||||||||||||||||
| Basic and diluted income (loss) |
0.4 | Nil | (7.4 | ) | Nil | Nil | Nil | Nil | ||||||||||||||||||||
| Statement of cash flow |
||||||||||||||||||||||||||||
| Net cash from Operating Activities |
$ | 36.6 | $ | 20.7 | $ | 47.7 | $ | 66.9 | $ | 71.6 | $ | 62.3 | $ | 60.9 | ||||||||||||||
| Net cash provided by (used in) Investing Activities |
(26.0 | ) | (12.8 | ) | 24.3 | (4.9 | ) | (6.9 | ) | (101.2 | ) | (80.1 | ) | |||||||||||||||
| Net cash (used in) provided by Financing Activities |
(15.4 | ) | (11.5 | ) | (55.2 | ) | (42.9 | ) | (64.1 | ) | 59.2 | 27.9 | ||||||||||||||||
| As of June 30, |
As of December 31, | |||||||||||||||||||||||||||
| 2019 | 2018 | 2018 | 2017 | 2016 | 2015 | 2014 | ||||||||||||||||||||||
| Balance sheet data (at period end) |
||||||||||||||||||||||||||||
| Total current assets |
99.5 | 76.5 | 99.0 | 77.4 | 57.1 | 57.6 | 36.7 | |||||||||||||||||||||
| Total vessels in operation |
1,118.0 | 595.3 | 1,112.8 | 586.5 | 707.3 | 838.4 | 826.2 | |||||||||||||||||||||
| Total assets |
1,236.3 | 671.8 | 1,233.5 | 675.9 | 777.2 | 904.9 | 873.7 | |||||||||||||||||||||
| Debt (current and non-current portion) |
865.2 | 390.9 | 877.2 | 398.5 | 419.9 | 478.1 | 401.9 | |||||||||||||||||||||
| Series B and C Preferred Shares |
— | — | — | — | — | — | — | |||||||||||||||||||||
| Class A and B common shares |
0.1 | 0.1 | 0.1 | 0.1 | 0.1 | 0.1 | 0.1 | |||||||||||||||||||||
| Shareholders’ equity |
335.2 | 260.1 | 316.4 | 251.6 | 328.9 | 395.8 | 438.1 | |||||||||||||||||||||
| Other data |
||||||||||||||||||||||||||||
| Number of vessels in operation at period end |
39 | 19 | 38 | 18 | 18 | 18 | 18 | |||||||||||||||||||||
| Ownership days |
6,912 | 3,271 | 7,675 | 6,570 | 6,588 | 6,893 | 6,270 | |||||||||||||||||||||
| Utilization |
96.9 | % | 98.4 | % | 98.7 | % | 98.4 | % | 98.4 | % | 99.6 | % | 98.0 | % | ||||||||||||||
19
Table of Contents
| (1) | On November 15, 2018, we completed a strategic combination with Poseidon Containers, acquiring 20 containerships, one of which, the Argos, was contracted to be sold which sale was completed in December 2018 (the “Poseidon Transaction”). The consideration given for the acquisition of the net assets was 3,005,603 Class A common shares and 250,000 Series C perpetual convertible preferred shares of par value $0.01 (the “Series C Preferred Shares”). Each Series C preferred share carries 38.75 votes and they are convertible in certain circumstances to 12,955,187 Class A common shares. References herein to “GSL Fleet” are to the 19 ships that were owned by us prior to the consummation of the Poseidon Transaction, and references to “Poseidon Fleet” are to the 19 ships that were acquired by us upon consummation of the Poseidon Transaction, excluding the Argos. |
| (2) | On January 2, 2019, as a consequence of the completion of the Poseidon Transaction, all of our issued and outstanding Class B common shares converted one-for-one into Class A common shares. On March 25, 2019, we effected a one-for-eight reverse stock split of our Class A common shares, which our shareholders authorized at our special meeting of shareholders held on March 20, 2019. There was no change to the trading symbol, number of authorized shares, or par value of our Class A common shares in connection with the reverse stock split. All share and per share amounts disclosed in this prospectus give effect to the reverse stock split retroactively, for all periods presented. |
Non-U.S. GAAP Financial Measures
To supplement our financial information presented in accordance with U.S. GAAP, we use certain “non-GAAP financial measures” as such term is defined in Regulation G promulgated by the SEC. Generally, a non-GAAP financial measure is a numerical measure of a company’s operating performance, financial position or cash flows that excludes or includes amounts that are included in, or excluded from, the most directly comparable measure calculated and presented in accordance with U.S. GAAP. We believe that the presentation of these measures provides investors with greater transparency and supplemental data relating to our financial condition and results of operations, and therefore a more complete understanding of factors affecting our business than U.S. GAAP measures alone. In addition, we believe that the presentation of these matters is useful to investors for period-to-period comparison of results as the items may reflect certain unique and/or non-operating items such as impairment charges, contract termination costs or items outside of our control.
We believe that the presentation of the following financial measures are useful to investors because they are frequently used by securities analysts, investors and other interested parties in the evaluation of companies in our industry. Adjusted EBITDA, Adjusted EBITDA Margin and Contracted Adjusted EBITDA are not defined in U.S. GAAP and should not be considered to be an alternative to net income or any other financial metric required by such accounting principles.
Non-U.S. GAAP measures
Adjusted EBITDA and Contracted Adjusted EBITDA are presented herein both on a historic basis and on a forward-looking basis in certain instances. We have not provided a reconciliation of any such forward looking non-U.S. GAAP financial measure to the most directly comparable U.S. GAAP measure because such U.S. GAAP financial measures on a forward-looking basis are not available to us without unreasonable effort.
Adjusted EBITDA
Adjusted EBITDA represents net income available to common shareholders before interest income and interest and other financial expense, income taxes, depreciation and amortization and earnings allocated to preferred shares. Adjusted EBITDA is a non-U.S. GAAP quantitative measure used to assist in the assessment of our operations. We believe that the presentation of Adjusted EBITDA is useful to investors because it is frequently used by securities analysts, investors and other interested parties in the evaluation of companies in our industry.
20
Table of Contents
(Expressed in millions of U.S. dollars)
| Six months ended | ||||||||||
| June 30, 2019 |
June 30, 2018 |
|||||||||
| Net income available to Common Shareholders |
18.8 | 8.2 | ||||||||
| Adjust: |
Depreciation and amortization |
21.7 | 16.3 | |||||||
| Interest income |
(0.8 | ) | (0.6 | ) | ||||||
| Interest and other financial expense |
38.1 | 21.5 | ||||||||
| Income taxes |
- | 0.1 | ||||||||
| Earnings allocated to preferred shares |
1.5 | 1.5 | ||||||||
|
|
|
|
|
|||||||
| Adjusted EBITDA |
79.3 | 47.0 | ||||||||
|
|
|
|
|
|||||||
Adjusted EBITDA Margin
Adjusted EBITDA Margin represents the Adjusted EBITDA for a period expressed as percentage of operating revenue for the same period.
| (Expressed in millions of U.S. dollars) | Six months ended | |||
| June 30, 2019 | ||||
| Operating revenues |
127.6 | |||
| Adjusted EBITDA |
79.3 | |||
|
|
|
|||
| Adjusted EBITDA Margin |
62.2 | % | ||
Contracted Adjusted EBITDA
Contracted Adjusted EBITDA represents our contracted future revenue multiplied by the Adjusted EBITDA Margin.
21
Table of Contents
CAUTIONARY STATEMENT REGARDING FORWARD-LOOKING STATEMENTS
This prospectus contains forward-looking statements. Forward-looking statements provide our current expectations or forecasts of future events. Forward-looking statements include statements about our expectations, beliefs, plans, objectives, intentions, assumptions and other statements that are not historical facts. Words or phrases such as “anticipate,” “believe,” “continue,” “estimate,” “expect,” “intend,” “may,” “ongoing,” “plan,” “potential,” “predict,” “project,” “will” or similar words or phrases, or the negatives of those words or phrases, may identify forward-looking statements, but the absence of these words does not necessarily mean that a statement is not forward-looking. Examples of forward-looking statements in this prospectus include, but are not limited to, statements regarding our disclosure concerning our operations, cash flows, financial position, dividend policy, the anticipated benefits of our strategic transaction with Poseidon Containers, and the likelihood of success in acquiring additional ships to expand our business.
Forward-looking statements appear in a number of places in this prospectus and in our Annual Report on Form 20-F for the year ended December 31, 2018, filed with the Commission on March 29, 2019, as updated by annual, quarterly and other reports and documents we file with the Commission after the date of this prospectus and that are incorporated by reference herein.
Forward-looking statements are subject to known and unknown risks and uncertainties and are based on potentially inaccurate assumptions that could cause actual results to differ materially from those expected or implied by the forward-looking statements. Our actual results could differ materially from those anticipated in forward-looking statements for many reasons, including the factors described in “Risk Factors” in this prospectus. The risks described under “Risk Factors” are not exhaustive. Other sections of this prospectus describe additional factors that could adversely affect our results of operations, financial condition, liquidity and the development of the industries in which we operate. New risks can emerge from time to time, and it is not possible for us to predict all such risks, nor can we assess the impact of all such risks on our business or the extent to which any risks, or combination of risks and other factors, may cause actual results to differ materially from those contained in any forward-looking statements. Accordingly, you should not unduly rely on these forward-looking statements, which speak only as of the date of this prospectus. We undertake no obligation to publicly update or revise any forward-looking statement to reflect circumstances or events after the date of this prospectus or to reflect the occurrence of unanticipated events. You should, however, review the factors and risks we describe in the reports we will file from time to time with the Commission after the date of this prospectus.
22
Table of Contents
An investment in our Class A common shares involves a high degree of risk. Before making an investment in our Class A common shares, you should carefully consider all of the information included or incorporated by reference into this prospectus, including the risks described herein and in “Item 3. Key Information—D. Risk Factors” in our 2018 Annual Report, which is incorporated by reference herein. The occurrence of one or more of those risk factors could adversely impact our business, financial condition or results of operations.
We cannot assure you if and when we will pay dividends on our Class A common shares.
We are not currently paying dividends on our Class A common shares. Subject to the limitations contained in the indenture governing our 2022 notes and other contractual obligations, we may resume the distribution of a portion of our cash flow to our shareholders, while retaining the remaining cash flow for costs such as drydockings, reinvestment in our business, funding ship or fleet acquisitions, making debt repayments and for other purposes, as determined by our board of directors. The timing and amount of any dividends declared will depend on, among other things (a) our results of operations, financial condition, cash flow and cash requirements, (b) our liquidity, including our ability to obtain debt and equity financing on acceptable terms as contemplated by our ship acquisition strategy, (c) restrictive covenants in our existing and future debt instruments and (d) provisions of Marshall Islands law. The declaration and payment of dividends is also subject at all times to the discretion of our board of directors.
The container shipping industry is highly volatile, and we cannot predict with certainty the amount of cash, if any, that will be available for distribution as dividends in any period. Also, there may be a high degree of variability from period to period in the amount of cash, if any, that is available for the payment of dividends. The amount of cash we generate from operations and the actual amount of cash we will have available for dividends in each quarter will vary based upon, among other things:
| • | the charter-hire payments we obtain from our charters as well as the rates obtained upon the expiration of our existing charters; |
| • | acquisition of additional ships or significant capital improvements; |
| • | the timing of scheduled drydockings; |
| • | the timing of interest payments, scheduled debt amortization payments and other payments that might be due under our debt facilities; |
| • | delays in the delivery of newbuilding ships, if any, and the beginning of payments under charters relating to those ships; |
| • | the level of our operating costs, such as the costs of crews, lubricants and insurance; |
| • | the number of unscheduled off-hire days for our fleet and the timing of, and number of days required for, scheduled dry-docking of our containerships; |
| • | any idle time after one charter expires until a new charter is agreed or the ship is disposed of, should a new charter not be agreed; |
| • | unexpected repairs to, or required expenditures on, ships or dry-docking costs in excess of those anticipated; |
| • | the loss of a ship; |
| • | prevailing global and regional economic and political conditions; |
| • | changes in interest rates; |
| • | the effect of governmental regulations and maritime self-regulatory organization standards on the conduct of our business; |
23
Table of Contents
| • | changes in the basis of taxation of our activities in various jurisdictions; |
| • | modification or revocation of our dividend policy by our board of directors; and |
| • | the amount of any cash reserves established by our board of directors. |
The amount of cash we generate from our operations may differ materially from our net income or loss for the period, which will be affected by non-cash items. We may incur other expenses or liabilities that could reduce or eliminate the cash available for distribution as dividends.
In addition, Marshall Islands law generally prohibits the payment of dividends other than from surplus (retained earnings and the excess of consideration received from the sale of shares above the par value of the shares) or if there is no surplus, from the net profits for the current and prior fiscal years, or while a company is insolvent or if it would be rendered insolvent by the payment of such a dividend. We may not have sufficient surplus or net profits in the future to pay dividends, and our subsidiaries may not have sufficient funds, surplus or net profits to make distributions to us. As a result of these and other factors, we may not be able to pay dividends during periods when we record losses and may not pay dividends during periods when we record net income. We can give no assurance that dividends will be paid in the future.
There may be a substantial number of our Class A common shares available for sale in the future that may adversely affect the market price of our Class A common shares.
On the closing of the Poseidon Transaction, we issued 3,005,603 Class A common shares and 250,000 Series C Preferred Shares, which are convertible into 12,955,187 Class A common shares upon the occurrence of certain events. Further, in connection with the Poseidon Transaction, pursuant to an Amended and Restated Registration Rights Agreement, we registered for resale all Class A common shares, including those issuable on conversion of the Series C Preferred Shares, held by affiliates of Kelso, CMA CGM, George Giouroukos (our Executive Chairman) through Management Investor Co., Michael S. Gross (our former Chairman and a director) and MAAS Capital as of the closing of the Poseidon Transaction. In September 2019, Kelso agreed to convert its Series C Preferred Shares upon the Company’s repayment of its 9.875% First Priority Secured Notes due 2022. The registration and availability of such a significant number of securities for trading in the public market may have a material adverse effect on the market price of our Class A common shares.
The price of our securities may be volatile.
The price of our Class A common shares may be volatile and may fluctuate due to factors such as:
| • | actual or anticipated fluctuations in our quarterly revenues and results of operations and those of publicly held containership owners or operators; |
| • | market conditions in the container shipping industry; |
| • | perceived counterparty risk; |
| • | shortfalls in our operating results from levels forecasted by securities analysts; |
| • | announcements concerning us or other containership owners or operators; |
| • | mergers and strategic alliances in the shipping industry; |
| • | changes in government regulation including taxation; and |
| • | the general state of the securities markets. |
The container shipping industry has been highly unpredictable and volatile. The market for common shares in companies operating in container shipping industry may be equally volatile.
24
Table of Contents
Future sales of our common stock could cause the market price of our common stock to decline.
Sales of a substantial number of shares of our common stock in the public market, or the perception that these sales could occur, may depress the market price for our common stock. These sales could also impair our ability to raise additional capital through the sale of our equity securities in the future.
Subject to the rules of the NYSE, in the future, we may issue additional shares of common stock, and other equity securities of equal or senior rank, without shareholder approval, in a number of circumstances. The issuance by us of additional shares of common stock or other equity securities of equal or senior rank would have the following effects:
| • | our existing shareholders’ proportionate ownership interest in us may decrease; |
| • | the dividend amount payable per share on our common stock may be lower; |
| • | the relative voting strength of each previously outstanding share may be diminished; and |
| • | the market price of our common stock may decline. |
Our shareholders also may elect to sell large numbers of shares held by them from time to time. The number of shares of common stock available for sale in the public market will be limited by restrictions applicable under securities laws, and agreements that we and our executive officers, directors and existing shareholders may enter into with the underwriters at the time of an offering. Subject to certain exceptions, these agreements generally restrict us and our executive officers, directors and existing shareholders from directly or indirectly offering, selling, pledging, hedging or otherwise disposing of our equity securities or any security that is convertible into or exercisable or exchangeable for our equity securities and from engaging in certain other transactions relating to such securities for a period of 180 days after the date of an offering prospectus without the prior written consent of the underwriter(s).
It may not be possible for investors to serve process on or enforce U.S. judgments against us.
We and all of our subsidiaries are incorporated in jurisdictions outside the U.S. and substantially all of our assets and those of our subsidiaries are located outside the U.S. In addition, most of our directors and officers are non-residents of the U.S., and all or a substantial portion of the assets of these non-residents are located outside the U.S. As a result, it may be difficult or impossible for U.S. investors to serve process within the U.S. upon us, our subsidiaries or our directors and officers or to enforce a judgment against us for civil liabilities in U.S. courts. In addition, you should not assume that courts in the countries in which we or our subsidiaries are incorporated or where our assets or the assets of our subsidiaries are located (1) would enforce judgments of U.S. courts obtained in actions against us or our subsidiaries based upon the civil liability provisions of applicable U.S. federal and state securities laws or (2) would enforce, in original actions, liabilities against us or our subsidiaries based on those laws
Increases in interest rates may cause the market price of our common shares to decline.
An increase in interest rates may cause a corresponding decline in demand for equity investments in general and in particular for yield-based equity investments such as our common shares. Any such increase in interest rates or reduction in demand for our common shares resulting from other relatively more attractive investment opportunities may cause the trading price of our common shares to decline.
25
Table of Contents
We estimate that we will receive net proceeds of approximately $44.6 million from this offering (approximately $51.3 million if the underwriters’ option to purchase additional shares is exercised in full), in each case after deducting underwriting discounts and commissions and estimated expenses payable by us.
We intend to use the net proceeds of this offering for general corporate purposes, which may include, among other things, the acquisition of containerships in accordance with our growth strategy, or prepaying debt. However, we do not currently have definitive plans for any debt prepayments nor have we identified any potential acquisitions, and we can provide no assurance that we will be able to complete any debt prepayment or the acquisition of any vessel that we are able to identify.
26
Table of Contents
The following table sets out our cash and cash equivalents and our capitalization on an actual, on an adjusted and on an as further adjusted basis as of June 30, 2019:
| • | on a historical basis; |
| • | on an adjusted basis to give effect to (i) the application of borrowings under our New Senior Loan described in footnote (3) below and (ii) the draw down of $12.0 million related to the acquisition of the GSL Grania on September 9, 2019; and |
| • | on an as further adjusted basis to give effect to (i) the issuance and sale of 6,620,686 shares of Class A common stock in this offering at an offering price of $7.25 per share and (ii) the application of the net proceeds of this offering as described under “Use of Proceeds”. The information set forth in the table assumes that the underwriters’ option to purchase additional shares is not exercised. You should read the information below together with the sections of this prospectus entitled “Use of Proceeds,” and “Risk Factors”, in addition to “Management’s Discussion and Analysis of Financial Condition and Results of Operations” as well as the financial statements and related notes which are incorporated by reference in this prospectus. |
| As of June 30, 2019 | ||||||||||||
| (In Thousands of U.S. Dollars) | Actual | As Adjusted | As Further Adjusted |
|||||||||
| Total Cash(1)(4) |
$ | 85,340 | $ | 85,340 | $ | 129,908 | ||||||
|
|
|
|
|
|
|
|||||||
| Debt (secured) |
||||||||||||
| Total Debt(2)(3) |
$ | 875,631 | $ | 888,301 | $ | 888,301 | ||||||
|
|
|
|
|
|
|
|||||||
| Shareholders’ equity: |
||||||||||||
| Class A common shares-authorized 214,000,000 shares with a $0.01 par value 9,942,950 shares issued and outstanding (as adjusted 16,563,636 shares issued and outstanding) |
99 | 99 | 166 | |||||||||
| Series B Preferred shares-authorized 16,100 shares with a $0.01 par value 14,000 shares issued and outstanding |
— | — | — | |||||||||
| Series C Preferred shares-authorized 250,000 shares with a $0.01 par value 250,000 shares issued and outstanding(5) |
3 | 3 | 3 | |||||||||
| Additional paid-in capital(4) |
512,379 | 512,379 | 556,880 | |||||||||
| Accumulated deficit |
(177,270 | ) | (177,270 | ) | (177,270 | ) | ||||||
|
|
|
|
|
|
|
|||||||
| Total stockholders’ equity |
335,211 | 335,211 | 379,779 | |||||||||
|
|
|
|
|
|
|
|||||||
| Total Capitalization |
$ | 1,210,842 | $ | 1,223,512 | $ | 1,268,080 | ||||||
|
|
|
|
|
|
|
|||||||
| (1) | Cash and cash equivalents, including restricted cash of $9,941. |
| (2) | Aggregated principal amount outstanding, excluding unamortized deferred financing costs of $8,146 and unamortized original issue discount on our 2022 Notes of $2,254 as of June 30, 2019. |
| (3) | $230.0 million has been drawn down under our New Senior Loan. |
| (4) | Additional paid- in-capital reflects the estimated net proceeds from this offering of $44.6 million, after deducting underwriting discount and commissions and other estimated offering expenses. |
| (5) | Series C Preferred shares convert to 12,955,187 Class A common shares in certain circumstances. |
27
Table of Contents
The declaration and payment of any dividend is subject at all times to the discretion of our board of directors which reviews our dividend policy quarterly, taking into consideration capital structure, growth opportunities, container shipping industry fundamentals, asset value trends and financial performance including cash flow, restrictions under our secured term loan and the indenture that governs our 2022 notes, the provisions of Marshall Islands law affecting the payment of distributions to shareholders, required capital and drydocking expenditures, reserves established by our board of directors, increased or unanticipated expenses, additional borrowings or future issuances of securities and other factors, many of which will be beyond our control.
For more information regarding our dividend policy, please see “Item 8. Financial Information—A. Consolidated Statements and Other Financial Information—Dividend Policy” in our 2018 Annual Report, which is incorporated by reference herein.
28
Table of Contents
Dilution or accretion is the amount by which the offering price paid by the purchasers of our common shares in this offering will differ from the net tangible book value per common share after the offering. The net tangible book value is equal to the amount of our total tangible assets (total assets less intangible assets) less total liabilities (other than intangible liabilities). The historical net tangible book value as of June 30, 2019 was $339.2 million in total and $34.12 per share for the number of outstanding shares at that date, or $14.81 per share assuming full conversion of Series C preferred shares into Class A common shares.
The as adjusted net tangible book value as of June 30, 2019 would have been $383.8 million, or $23.17 per common share after the issuance and sale by us of common shares at $7.25 per share in this offering, after deducting estimated underwriting discounts and commissions and other expenses related to this offering, or $13.00 per share assuming full conversion of Series C preferred shares into Class A common shares. This represents an immediate reduction in net tangible book value of $10.95 per share to the existing shareholders or $1.81 per share assuming full conversion of Series C preferred shares into Class A common shares and an immediate accretion in net tangible book value of $15.92 per share to new investors. The information set forth in the table assumes that the underwriter’s option to purchase additional shares is not exercised.
The following table illustrates the pro forma per share accretion and reduction in net tangible book value per share as of June 30, 2019:
| Public offering price per common share |
$ | 7.25 | ||
| As adjusted net tangible book value per share before this offering |
$ | 34.12 | ||
| Reduction in as adjusted net tangible book value per share attributable to new investors in this offering |
$ | 10.95 | ||
| As further adjusted net tangible book value per share after giving effect to this offering |
$ | 23.17 | ||
| Accretion per share to new investors |
$ | 15.92 |
The following table summarizes, as of June 30, 2019, on an as further adjusted basis for this public offering, the difference between the number of common shares acquired from us, the total amount paid and the average price per share paid by the existing shareholders and the number of common shares acquired from us, the total amount paid and the average price per share paid by you as a new investor in this offering, based upon the public offering price of $7.25 per share.
| As Further Adjusted Shares Outstanding(1) |
Total Consideration | Average |
||||||||||||||||||
| Number | Percent | Amount (In USD Thousands) |
Percent | |||||||||||||||||
| Existing shareholders(*) |
158,620 | 2.40 | % | $ | 1,149,995 | 2.40 | % | $ | 7.25 | |||||||||||
| New investors(**) |
6,462,066 | 97.60 | % | $ | 46,849,979 | 97.60 | % | $ | 7.25 | |||||||||||
| Total |
6,620,686 | 100.00 | % | $ | 47,999,974 | 100.00 | % | $ | 7.25 | |||||||||||
(*) Members of management who are existing shareholders and who are participating in the offering.
(**) Before deducting estimated underwriting discount and commissions and other expenses of this offering of $3.4 million.
29
Table of Contents
The following table sets forth selected consolidated financial and other data of the Company for the years ended December 31, 2018, 2017 and 2016 and as of December 31, 2018 and 2017 which is derived from our audited consolidated financial statements included in our annual report on Form 20-F for the year ended December 31, 2018, filed with the SEC on March 29, 2019, incorporated by reference herein. The selected consolidated financial and other data of the Company as of December 31, 2016, 2015 and 2014 and for the years ended December 31, 2015 and 2014, is derived from our audited consolidated financial statements not incorporated by reference herein but publicly available at www.sec.gov. The table also sets forth selected consolidated financial and other data of the Company as of June 30, 2019 and 2018 and for the six month periods ended June 30, 2019 and 2018 which is derived from our unaudited consolidated financial statements and the notes thereto, included in our Report on Form 6-K that was filed with the SEC on August 9, 2019, which is incorporated by reference herein.
The selected financial data set forth below should be read in conjunction with, and are qualified in their entirety by reference to, (i) our audited consolidated financial statements, including the related notes thereto, and “Item 5. Operating and Financial Review and Prospects,” as presented in our 2018 Annual Report, incorporated by reference herein, and (ii) our interim unaudited consolidated financial statements and “Management’s Discussion and Analysis of Financial Condition and Results of Operations” as presented in our Report on Form 6-K, filed with the Commission on August 9, 2019, incorporated by reference herein. The selected historical financial information provided below does not purport to indicate results of operations as of any future date or for any future period.
CONSOLIDATED FINANCIAL DATA
| Six months ended June 30, |
Year ended December 31, | |||||||||||||||||||||||||||
| Selected Consolidated Statements of Income Data: | 2019 | 2018 | 2018 | 2017 | 2016 | 2015 | 2014 | |||||||||||||||||||||
| (Expressed in millions of U.S. dollars, except for per share data) | ||||||||||||||||||||||||||||
| Statements of Income |
||||||||||||||||||||||||||||
| Operating revenues: |
||||||||||||||||||||||||||||
| Time charter revenue |
$ | 127.6 | $ | 71.2 | $ | 157.1 | $ | 159.3 | $ | 166.8 | $ | 165.3 | $ | 138.7 | ||||||||||||||
| Operating expenses: |
||||||||||||||||||||||||||||
| Vessel operating expenses |
(41.8 | ) | (20.4 | ) | (49.3 | ) | (42.7 | ) | (45.4 | ) | (48.9 | ) | (47.6 | ) | ||||||||||||||
| Time charter and voyage expenses |
(3.6 | ) | (0.4 | ) | (1.6 | ) | (1.0 | ) | (0.7 | ) | (1.6 | ) | (1.3 | ) | ||||||||||||||
| Depreciation and amortization |
(21.7 | ) | (16.3 | ) | (35.5 | ) | (38.0 | ) | (42.8 | ) | (44.9 | ) | (41.1 | ) | ||||||||||||||
| Impairment of vessels |
— | — | (71.8 | ) | (87.6 | ) | (92.4 | ) | (44.7 | ) | — | |||||||||||||||||
| General and administrative expenses |
(4.1 | ) | (3.4 | ) | (9.2 | ) | (5.4 | ) | (6.2 | ) | (6.5 | ) | (7.0 | ) | ||||||||||||||
| Total operating expenses |
(71.2 | ) | (40.5 | ) | (167.4 | ) | (174.7 | ) | (187.5 | ) | (146.6 | ) | (97.0 | ) | ||||||||||||||
| Operating income (loss) |
56.4 | 30.7 | (10.3 | ) | (15.4 | ) | (20.7 | ) | 18.7 | 41.7 | ||||||||||||||||||
| Non-operating income (expense) |
||||||||||||||||||||||||||||
| Interest income |
0.8 | 0.6 | 1.4 | 0.5 | 0.2 | 0.1 | 0.1 | |||||||||||||||||||||
| Interest and other finance expenses |
(38.1 | ) | (21.5 | ) | (48.7 | ) | (59.4 | ) | (44.8 | ) | (48.2 | ) | (43.9 | ) | ||||||||||||||
| Gain on redemption of Series A Preferred Shares |
— | — | — | — | — | — | 8.6 | |||||||||||||||||||||
| Realized loss on interest rate derivative |
— | — | — | — | — | — | (2.8 | ) | ||||||||||||||||||||
| Unrealized gain on interest rate derivative |
— | — | — | — | — | — | 1.9 | |||||||||||||||||||||
| Other income, net |
1.2 | — | 0.3 | 0.1 | 0.2 | 0.6 | 0.6 | |||||||||||||||||||||
| Income (loss) before income taxes |
20.3 | 9.8 | (57.3 | ) | (74.2 | ) | (65.1 | ) | (28.8 | ) | 6.2 | |||||||||||||||||
| Income taxes |
— | (0.1 | ) | — | — | — | — | (0.1 | ) | |||||||||||||||||||
30
Table of Contents
| Net income (loss) |
20.3 | 9.7 | (57.3 | ) | (74.2 | ) | (65.1 | ) | (28.8 | ) | 6.1 | |||||||||||||||||
| Earnings allocated to Series B Preferred Shares |
(1.5 | ) | (1.5 | ) | (3.1 | ) | (3.1 | ) | (3.1 | ) | (3.1 | ) | (1.1 | ) | ||||||||||||||
| Net income (loss) available to common shareholders |
18.8 | 8.2 | (60.4 | ) | (77.3 | ) | (68.2 | ) | (31.9 | ) | 5.0 | |||||||||||||||||
| Net income (loss) per Class A common share, in $ |
||||||||||||||||||||||||||||
| Basic and diluted |
0.82 | 1.36 | (7.42 | ) | (12.89 | ) | (11.39 | ) | (5.36 | ) | 0.8 | |||||||||||||||||
| Weighted average number of Class A common shares outstanding |
||||||||||||||||||||||||||||
| Basic and diluted in millions |
9.94 | 6.0 | 6.5 | 6.0 | 6.0 | 6.0 | 6.0 | |||||||||||||||||||||
| Net income per Class B common share, in $ |
||||||||||||||||||||||||||||
| Basic and diluted |
Nil | Nil | Nil | Nil | Nil | Nil | Nil | |||||||||||||||||||||
| Weighted average number of Class B common shares outstanding |
||||||||||||||||||||||||||||
| Basic and diluted in millions |
Nil | 0.9 | 0.9 | 0.9 | 0.9 | 0.9 | 0.9 | |||||||||||||||||||||
| Dividend per Class A common share in $ |
— | — | — | — | — | 0.02 | — | |||||||||||||||||||||
| Weighted average number of Class C preferred shares outstanding |
||||||||||||||||||||||||||||
| Basic and diluted in millions |
13.0 | Nil | 1.6 | Nil | Nil | Nil | Nil | |||||||||||||||||||||
| Net income (loss) per Class C preferred share, in $ |
||||||||||||||||||||||||||||
| Basic and diluted income (loss) |
0.4 | Nil | (7.4 | ) | Nil | Nil | Nil | Nil | ||||||||||||||||||||
| Statement of cash flow |
||||||||||||||||||||||||||||
| Net cash from Operating Activities |
$ | 36.6 | $ | 20.7 | $ | 47.7 | $ | 66.9 | $ | 71.6 | $ | 62.3 | $ | 60.9 | ||||||||||||||
| Net cash provided by (used in) Investing Activities |
(26.0 | ) | (12.8 | ) | 24.3 | (4.9 | ) | (6.9 | ) | (101.2 | ) | (80.1 | ) | |||||||||||||||
| Net cash (used in) provided by Financing Activities |
(15.4 | ) | (11.5 | ) | (55.2 | ) | (42.9 | ) | (64.1 | ) | 59.2 | 27.9 | ||||||||||||||||
| As of June 30, |
As of December 31, | |||||||||||||||||||||||||||
| 2019 | 2018 | 2018 | 2017 | 2016 | 2015 | 2014 | ||||||||||||||||||||||
| Balance sheet data (at period end) |
||||||||||||||||||||||||||||
| Total current assets |
99.5 | 76.5 | 99.0 | 77.4 | 57.1 | 57.6 | 36.7 | |||||||||||||||||||||
| Total vessels in operation |
1,118.0 | 595.3 | 1,112.8 | 586.5 | 707.3 | 838.4 | 826.2 | |||||||||||||||||||||
| Total assets |
1,236.3 | 671.8 | 1,233.5 | 675.9 | 777.2 | 904.9 | 873.7 | |||||||||||||||||||||
| Debt (current and non-current portion) |
865.2 | 390.9 | 877.2 | 398.5 | 419.9 | 478.1 | 401.9 | |||||||||||||||||||||
| Series B and C Preferred Shares |
— | — | — | — | — | — | — | |||||||||||||||||||||
| Class A and B common shares |
0.1 | 0.1 | 0.1 | 0.1 | 0.1 | 0.1 | 0.1 | |||||||||||||||||||||
| Shareholders’ equity |
335.2 | 260.1 | 316.4 | 251.6 | 328.9 | 395.8 | 438.1 | |||||||||||||||||||||
| Other data |
||||||||||||||||||||||||||||
| Number of vessels in operation at period end |
39 | 19 | 38 | 18 | 18 | 18 | 18 | |||||||||||||||||||||
| Ownership days |
6,912 | 3,271 | 7,675 | 6,570 | 6,588 | 6,893 | 6,270 | |||||||||||||||||||||
| Utilization |
96.9 | % | 98.4 | % | 98.7 | % | 98.4 | % | 98.4 | % | 99.6 | % | 98.0 | % | ||||||||||||||
| (1) | On November 15, 2018, we completed a strategic combination with Poseidon Containers, acquiring 20 containerships, one of which, the Argos, was contracted to be sold which sale was completed in December 2018 (the “Poseidon Transaction”). The consideration given for the acquisition of the net assets was 3,005,603 Class A common shares and 250,000 Series C perpetual convertible preferred shares of par value $0.01 (the “Series C Preferred Shares”). Each Series C preferred share carries 38.75 votes and they are convertible in certain circumstances to a total of 12,955,187 Class A common shares. |
31
Table of Contents
| (2) | On January 2, 2019, as a consequence of the completion of the Poseidon Transaction, all of our issued and outstanding Class B common shares converted one-for-one into Class A common shares. On March 25, 2019, we effected a one-for-eight reverse stock split of our Class A common shares, which our shareholders authorized at our special meeting of shareholders held on March 20, 2019. There was no change to the trading symbol, number of authorized shares, or par value of our Class A common shares in connection with the reverse stock split. All share and per share amounts disclosed in this prospectus give effect to the reverse stock split retroactively, for all periods presented. |
32
Table of Contents
THE INTERNATIONAL CONTAINER SHIPPING AND CONTAINERSHIP LEASING INDUSTRY
Maritime Strategies International Ltd. (“MSI”) has provided certain statistical and graphical information contained in this prospectus under the caption “The International Container Shipping and Containership Leasing Industry.” MSI has advised that (i) some information in MSI’s database is derived from estimates derived from industry sources or subjective judgments, (ii) the information in the databases of other maritime data collection agencies may differ from the information in MSI’s database, (iii) whilst MSI has taken reasonable care in the compilation of the statistical and graphical information and believes it to be accurate and correct, data compilation is subject to limited audit and validation procedures and may accordingly contain errors, (iv) MSI, its agents, officers and employees cannot accept liability for any loss suffered in consequence of reliance on such information or in any other manner, and (v) the provision of such information does not obviate any need to make appropriate further enquiries.
Industry Overview
Containerization is the most convenient and cost-effective way to transport a wide range of cargoes, predominantly a diverse selection of consumer, manufactured, and semi-manufactured goods. Furthermore, emissions per ton-mile of cargo carried compare favorably to other existing modes of transport. The first containerized cargoes were shipped in the mid-1950s; global containerized trade volumes for 2018 are estimated to be 208 million TEU.
The containerized supply chain extends throughout the world. The Mainlane trades are those linking the major manufacturing economies in Asia with the major consumer economies in North America and Europe and the trans-Atlantic trade. However, over 70% of global containerized trade volumes are in the non-Mainlane trades, with intra-regional trades alone representing almost 39%. Indeed, the largest trade grouping comprises the intra-Asian trades connecting that region’s rapidly growing markets.
Growth in containerized trade is linked to consumer-led demand for manufactured goods and thereby to regional economic growth. Historically, underlying growth has been boosted by both the containerization of breakbulk goods, including refrigerated cargoes, and the relocation of manufacturing from developed economies such as those in Europe and North America, to lower cost regions, most notably in Asia. Of these, the continued containerization of refrigerated (or ‘reefer’) cargoes is expected to outpace overall container trade growth and drive fast growth on certain trade routes.
From 1993 to 2008, containerized trade grew at a compound annual rate of over 9.0%, driven by China’s infrastructural investment growth and integration into the global trade system, macroeconomic and construction booms in the United States and Western Europe, the off-shoring of production, and the expansion of global supply chains. 2009, due to the global financial crisis and recession, was the only year of negative growth in the industry’s history, with volumes shrinking 8.0%. Volumes recovered in 2010, with growth of 15.0%.
Between 2011 and 2018 average compound annual growth of containerized was 3.5%. More recently, over the first six months of 2019 estimated growth in primary container trade was just over 2.4% as slower global macroeconomic growth and the impact of increased trade tensions weighed on volumes. A similar pace of expansion is expected in the second half of 2019, while containerized trade growth is forecast to accelerate in 2020.
The rapid expansion in containerized trade has also led to a rapid expansion in the global containership fleet, of which the vast majority of vessels are fully cellular containerships: vessels specialized for the transport of containers and fitted with cell guides throughout the ship to optimize container stowage and significantly enhance the efficiency of load and discharge operations. Between 1995 and 2008, the nominal carrying capacity of the industry-wide fully cellular fleet grew by a compound annual rate of 11.4%; and from 2009 through 2018 at 6.1%, as the industry digested the legacy, pre-crisis orderbook. As at June 30, 2019, industry-wide fleet capacity stood at 22.3 million TEU, aboard a total of 5,165 vessels.
33
Table of Contents
Demand Growth v. Supply Growth, Including 2019 and 2020 Forecasts

Containerships have been upsized over time to carry increasing cargo volumes and reduce unit costs. Whereas in 1995 the largest vessel in the global fleet had a nominal capacity of 5,344 TEU, as at June 30, 2019, the largest vessel had a nominal capacity of 21,413 TEU. Over the same period, average containership nominal capacity across the industry increased from 1,020 TEU to 4,344 TEU.
Within the container shipping industry, key participants include shippers, liner companies and charter-owners. Shippers are the senders and receivers of containerized cargo (Walmart is a typical example). Liner companies (also referred to as lines or operators) are logistics service providers responsible for the seaborne, and often also inland, transportation of containerized goods; they negotiate freight rates with shippers themselves, or with third parties such as freight forwarders/consolidators. Liner companies either operate vessels that they themselves own, or lease vessels from charter-owners. Charter-owners (also referred to as containership owners and containership lessors) provide the function of owning containerships and leasing, or chartering, them out to liner companies. In 1995, approximately 16.0% of operated capacity across the industry was provided by charter-owners. As at June 30, 2019, 54.0% of the industry-wide operated fleet by TEU capacity and 54.6% by number of ships, was provided by charter-owners. Within the sub-10,000 TEU fleet, 58.3% of the operated fleet by TEU capacity and 55.9% by number of ships was provided by charter-owners.
In the containership charter market, leases are most often structured as time charters. Under a time charter, with the exception of fuel (which is paid for by the lessee), the operating costs of the vessel—and freight-related risks—are borne by the lessor. Charter periods can vary in length: the spot market generally refers to charter fixtures of 12 months or less, while term charters cover longer fixtures, with periods of five years or more not uncommon. Charter terms of more than seven years are normally associated with the provision of hitherto off-balance-sheet finance supporting investment in newbuild vessels.
The containership market is currently undergoing a major structural shift as a result of changes to the global regulations that govern vessel Sulphur emissions. Sulphur Dioxide (SOx) is produced as a by-product of burning conventional bunker fuels, and successive rounds of legislation set by the International Maritime Organisation have focused upon reducing the associated air pollution. Under regulations in place prior to January 1, 2020, vessels can consume bunker fuel with a maximum Sulphur content of 3.5% (except in certain coastal areas, where the limit is 0.1% Sulphur content). From January 1, 2020, the maximum Sulphur content of bunker fuel will be reduced to 0.5%. This applies across the merchant shipping fleet, and not only to containerships.
34
Table of Contents
Vessel operators have three broad options to comply with the new regulations. Each option will involve increased expenditure, and how different operators choose among the options will influence the overall supply of the containership fleet and the relative competitiveness between individual vessels.
First, vessel owners can choose to switch to alternative fuels. At present the primary such alternative is Liquefied Natural Gas (LNG), which produces no Sulphur Dioxide and as of Q3 2019 offered lower daily fuel costs than conventional bunker fuels. Installing LNG bunkering infrastructure is highly capital intensive, however, and retrofitting the technology onto existing vessels is perceived as economically non-viable. So far, the only global liner operator to have committed to this technology in a significant way is CMA CGM, which has an 18-vessel newbuilding plan of LNG-fueled tonnage.
Second, vessel operators can choose to install exhaust gas cleaning technology (‘scrubbers’) that removes (or ‘scrubs’) the Sulphur Dioxide content from a vessel’s exhaust emissions. This has proven a popular option, as installing a scrubber will allow vessel operators to continue to burn High Sulphur Fuel Oil (HSFO) after January 1, 2020, capitalizing on the pricing arbitrage expected in the short to medium term between the price of High Sulphur and Low Sulphur fuels.
Installing a scrubber requires upfront capital expenditure, approximately $3.0-6.0 million depending on vessel size and scrubber specification. The return on installing a scrubber derives from fuel expenditure savings, which in turn depend on the price differential between high- and low-Sulphur bunker fuel. In the container shipping sector, fuel is paid for by the liner operator. Consequently, containership-owners must be able to charge a charter rate premium to liner operators in order to justify investing in scrubbers. Industry uptake of scrubbers has exceeded initial expectations. As of June 30, 2019, 60 containerships totaling 0.3 million TEU were installed with scrubbers. This was equivalent to 1.1% of the containership fleet by number of vessels, and 1.3% of the fleet by TEU capacity. It is expected that around 35% of containerships by TEU capacity and around 15% by number of ships will eventually be scrubber-fitted. As it takes around six to eight weeks to install a scrubber on an existing vessel, during which time the vessel is taken out of service, an increase in vessels undergoing scrubber installation has the effect of temporarily reducing fleet supply.
Third, vessel operators can comply with the IMO 2020 regulations by consuming bunker fuel with 0.5% Sulphur content. This is the default option, and the large majority of small and mid-size containerships will switch to burning Low Sulphur Fuel Oil (LSFO) from January 1, 2020, onwards. Low Sulphur fuel is expected to cost more than high Sulphur fuel, at least in the short to medium term. The pricing spread is not yet clear, but forward curves suggest a differential of around $200 per mt.
There are numerous implications from these changes. The compliance method chosen will become an additional source of differentiation between vessels, and vessel-specific fuel efficiency considerations are expected to be increasingly relevant. Further, if industry bunker expenditure does increase as expected, it is possible that liner companies will respond by slowing vessel operating speeds further, as relative fuel consumption is lower at lower speeds, and by chartering fuel efficient vessels where available. Slowing the global fleet by 1 knot would imply a reduction in effective supply of 6.7% (assuming trading patterns and port stays as at June 30, 2019).
Demand
Global container trade predominantly involves the movement of manufactured and semi-manufactured goods. Growth drivers include the increasing consumption of manufactured goods, the containerization of goods formerly transported by other vessel types (above all refrigerated cargoes), and the offshoring of manufacturing and extension of global supply chains. Consequently, historically containerized trade has tended to expand at a multiple of both global Gross Domestic Product (“GDP”) growth and total seaborne trade growth.
The container trade growth-multiplier effect was disrupted in 2015 and 2016, when both seaborne and container trade grew slower than world GDP. In 2015 container trade grew by 1.7%, compared against world
35
Table of Contents
GDP growth of 3.4%, and in 2016 container trade grew by around 2.8% and world GDP by around 3.4%. In 2017 the container trade growth multiplier strengthened notably and remained in positive territory in 2018. World GDP growth and container trade growth have faced headwinds in 2019, with container trade forecast to grow by 2.8% and world GDP growth by 3.2%. However, container trade growth is forecast to accelerate in 2020, with a return of the positive differential between containerized trade growth and GDP growth. In 2020 the IMF forecasts world GDP will grow by 3.5%, while containerized trade is forecast to grow by 4.1%.
Growth of Containerized Trade, Including 2019 and 2020 Forecasts

Traditionally, global container trade has been separated into four different trade groupings: the arterial East-West Trades (“Mainlanes”), the non-Mainlane East-West trades, North-South trades and intra-regional trades.
The Mainlane trades are the major East-West routes connecting Asia, North America and Europe: the Asia-Europe, Transpacific and Transatlantic trades. Of these, the Transpacific (commonly taken to refer to all cargoes moved between Asia and North America, regardless of whether they cross the Pacific or go via the Suez Canal) and Asia-Europe are the largest.
Cargoes on the Asia-Europe and, to some degree, on the Transpacific trades tend to be carried on the largest vessels (over 10,000 TEU) since the length and high cargo volumes of these trades, combined with well-developed port infrastructure, allow such vessels to maximize their economies of scale. Asia-Europe services across the industry deploy the fleet’s largest vessels, trending towards 18,000 TEU or larger, with an average ship size of 15,370 TEU. Excluding the bottom and top decile of vessels by nominal TEU capacity, vessels deployed on Asia-Europe services trades range in size from 10,034 to 20,388 TEU. On Transpacific services the average ship size is 9,000 TEU. Excluding the bottom and top decile of vessels by nominal TEU capacity, vessels deployed on Transpacific services trades range in size from 5,060 to 13,169 TEU.
Although during the mid-2000s the Asia-Europe and Transpacific trades saw rapid growth, particularly on the stronger Asian export leg, the compound annual growth rate for all the Mainlane trades has declined since the global financial crisis. The compound annual growth rate fell to just under 3.0% over the period 2010-2012, and just over 3.1% between 2013 and 2018. Growth over the six months to June 30, 2019 is estimated at 3.7%.
36
Table of Contents
The non-Mainlane East-West trades are those which link the Middle East and Indian Subcontinent to Asia, Europe and North America. Of these, the most significant is the Westbound Asia-Middle East/Indian Subcontinent trade, which in 2018 represented nearly 5.5% of global volumes. While historically these trades have been served by smaller vessels than those deployed on the Mainlane trades, the combination of relatively high cargo volumes and port infrastructure development has resulted in the deployment of vessels of 10,000 TEU or larger on some service loops (with vessels on one current service reaching 21,000 TEU). The average vessel size on non-Mainlane East-West trades is 6,400 TEU. Excluding the bottom and top decile of vessels by nominal TEU capacity, vessels deployed on non-Mainlane East-West trades range in size from 1,708 to 11,010 TEU.
North-South trades are those which connect North America, Europe and Asia with Central and South America, Sub-Saharan Africa and Oceania. North-South trades grew by a compound annual rate of 3.1% from 2010 to 2018 across the industry and the largest of them – the Southbound Asia-Latin America trade – is projected to total 4.5 Mn TEU in 2019. Vessels serving these trades span the range of large feeders (around 2,700 TEU), up to 13,500 TEU vessels on selected Far East to West Africa trades. Average vessel size is 5,000 TEU. Excluding the bottom and top decile of vessels by nominal TEU capacity, vessels deployed on North-South trades range in size from 1,756 to 9,234 TEU.
Intra-regional trades are the largest trade grouping and include the intra-Asian, intra-European and intra-Latin America and Caribbean trades. Of these, the largest is the intra-Asian trade, representing approximately one third of global containerized volumes. Each intra-regional trade is made up of many different sub-trades, which may have very different characteristics. Consequently, intra-regional trades are served by a wide range of vessels, ranging from containerships under 1,000 TEU up to vessels in excess of 5,200 TEU. However, for a majority of the intra-regional sub-trades either low freight volumes, short distances or port restrictions make them most suited to smaller vessels; in some cases only smaller vessels equipped with gear—i.e. those with their own cranes to load and unload containers—are viable. On intra-regional trades the average vessel size is 1,773 TEU. Excluding the bottom and top decile of vessels by nominal TEU capacity, vessels deployed on intra-regional trades range in size from 561 to 4,211 TEU.
The chart below breaks down estimated global containerized volumes by trade grouping in 2018, while the subsequent chart shows estimated annual growth by trade grouping from 2016 through 2018, with forecast values for 2019 and 2020.
37
Table of Contents
Global Container Trade by Trade Grouping, Full Year 2018 Estimates

Annual Container Trade Growth by Trade Grouping, Including 2019 and 2020 Forecasts

The pie chart illustrates the broad-based nature of global container trade, with limited exposure to any single trade-lane. This is significant in the context of the US-China trade conflict which began in 2018. The Transpacific trades represent 12.5% of overall volumes, while trade between China and the US (and vice-versa) represents 6.7% of global containerized volumes. Furthermore, a consequence of the trade conflict has been the
38
Table of Contents
increased market share of non-Chinese manufacturers on the Asia-US trade via a process of cargo substitution. Over the first six months of 2019, US containerized imports from ASEAN countries grew by 23.0% (equal to an increase of 295,000 TEU), while imports from China and Hong Kong shrank by 5.3% (equal to a decrease of 290,000 TEU). Over the same period US imports from Japan, South Korea and Taiwan grew by 8.9% (equal to an increase of 93,000 TEU).
Supply
As at June 30, 2019, 5,165 containerships with a nominal capacity totaling 22.3 million TEU were on the water. A further 2.5 million TEU were on order, for delivery through 2022. ‘Nominal capacity’ refers to the maximum number of 20-foot containers that a vessel can carry, without regard to weight restrictions. A more realistic measure of the cargo carrying capacity of a containership is its homogenous intake at 14 mt per TEU.
Containerships range in size from under 500 TEU to over 23,000 TEU. There is considerable overlap in trading patterns for each size segment of the containership fleet and these patterns have evolved, and continue to evolve, over time. Since 2008, the tonnage cascade – which refers to the process of the deployment of larger vessels which displace smaller vessels which, in turn, displace even smaller vessels onto other tradelanes – has accelerated due to the top-heavy orderbook and comparatively weaker recent volume growth on the Mainlanes. As at June 30, 2019 76.0% of capacity over 10,000 TEU, was deployed on Mainlane trades. However, mid-sized and smaller tonnage remains core to global container shipping networks, especially on the non-Mainlane and large intra-regional trades such as intra-Asia.
Containership Fleet Composition by # of Vessels, June 30, 2019

39
Table of Contents
Containership Deployment by Trade, as at June 30, 2019

Deployment for the 5,100-7,499 TEU and 4,000-5,099 TEU fleet segments is split more evenly: for vessels in the 5,100-7,499 TEU segment the Mainlanes provide 31.0% of employment, non-Mainlane East-West and North-South trades combined a further 59.0%, and longer-haul regional routes the remaining 10.0%; for vessels in the 4,000-5,099 TEU ‘classic’ Panamax segment, Mainlane trades provide 19.0% of employment, non-Mainlane East-West trades 7.0%, North-South trades 33.0%, and regional and South-South routes the remaining 41.0%. Significant numbers of ‘classic’ Panamax vessels have been re-deployed to what were traditionally ‘feeder’ trades in recent years.
Non-Mainlane East-West and North-South trades provide employment to half of the 3,000-3,999 TEU fleet segment, with most of the remainder employed on regional routes. Vessels below 3,000 TEU (“feeder vessels”) are most commonly employed on intra-regional trades, which account for 79.0% of feeder deployment; North-South trades account for an additional 12.0%, with the remainder split between non-Mainlane East-West and specialist Mainlane routes.
Generally speaking, deployment on Mainlane trades is not limited by ‘hard’ physical size restrictions. This certainly applies to the major European, Middle Eastern and Far East ports, which can accommodate the largest vessels in the fleet. Whilst in theory some North American ports can also accommodate 18,000 TEU vessels, liner companies have been reluctant to deploy these larger vessels in North America to date.
Deployment on non-Mainlane trades is more often subject to physical constraints, such as shallow draft, length restrictions, and limited shore-side infrastructure. Factors such as these can be compounded by liner companies’ desire not to tie up their larger, strategic vessels in congested or otherwise inefficient ports. In emerging markets, under-developed shore-side infrastructure can also create a requirement for geared vessels with their own cranes to load and unload cargo. As at June 30, 2019, 10.0% of the global fleet (by TEU capacity)
40
Table of Contents
was geared, while geared tonnage represented only 2.4% of the industry-wide orderbook. The simple average age of the geared fleet across the industry was 15.1 years.
In addition to infrastructure considerations, some key restrictions to introducing larger vessels onto many regional services are commercial. Due to short voyage distances, frequent port calls and lower volumes, it can be challenging to both maintain a high-frequency service and keep vessel utilization at a profitable level when larger vessels are introduced. This difficulty is compounded when a route is served by many independent operators. On regional trades, the liner operator landscape remains highly fragmented.
Growth of the containership fleet has been driven by anticipated growth in containerized trade, together with up-sizing of vessels to achieve economies of scale. Between 1995 and 2008, the nominal carrying capacity of the industry-wide fully cellular fleet grew by a compound annual rate of 11.4%; and from 2009 through 2018 at 6.1%. On June 30, 2019, the fleet was 1.3% larger than at the end of 2018, and fleet growth over the remainder of 2019 and in 2020 is expected to be moderate.
The orderbook-to-fleet ratio is a key indicator of the pace of fleet growth in future years. For containerships this measure peaked at over 60.0% in 2007. As at December 31, 2018, it was 12.3%, and by June 30, 2019, the global orderbook-to-fleet ratio had fallen to 11.2%.
Historical Development of the Containership Fleet

In recent years, ordering has been heavily weighted towards larger vessels, and consequently the orderbook, both in absolute terms and as a percentage of the existing fleet, is highest in the segment for vessels over 10,000 TEU. As at June 30, 2019, the orderbook-to-fleet ratio across the industry for mid-size and smaller vessels (9,999 TEU and below) was 3.7%, and 2.6% for ships of 2,000 – 9,999 TEU. As of June 30, 2019, there were no vessels on order between 4,000-10,000 TEU, a segment of the fleet that accounts for 44.0% of the global fleet by TEU capacity. The lead time for ordering and delivering a new ship would likely be approximately two years.
41
Table of Contents
Estimated Capacity on Order by Segment, as at June 30, 2019

Containership newbuildings are either contracted by a liner company intending to operate the vessel, or by an independent charter-owner planning to charter it to a line. Charter-owners either order vessels with pre-arranged term charters to a liner company—often referred to as a “back-to-back” arrangement—or on a speculative basis, hoping to fix the vessel on the open market once it is delivered.
The sector has been capital-constrained since 2008. This is a product of the retrenchment of shipping banks (particularly those based in Europe) and the decline of the German KG environment (which is covered in the “Containership Leasing” section). While alternative capital providers, including private equity and Chinese leasing companies, have increased their activity within the sector, financial distress and a generally more stringent regulatory environment for the major shipping banks have restricted the funding available to the industry.
Consequently, since the global financial crisis, the ordering of new containerships has been by the liner companies themselves and by the relatively few charter-owners with access to capital. In recent years, speculative ordering has been rare, with most newbuilding commitments made by charter-owners made back-to-back with long-term charters to established liner operators. Chinese leasing companies have been increasingly active as a source of financing for top tier liner companies—largely as a substitute for conventional senior lending that would historically have been provided by European shipping banks.
The weighting of the orderbook towards larger vessels also implies that the near-term impact of the new generation of fuel-efficient “eco-ships”—referring to new designs of vessels which are configured to offer reduced fuel consumption and are optimized to operate at lower speeds—may be more pronounced in the larger size segments and under-represented in the mid-sized and smaller vessel segments. Furthermore, the contracting of such tonnage by liner companies or, on a back-to-back basis, by charter-owners implies that such vessels are unlikely to be a significant component of the spot charter market for some time. Consequently, it is expected that those eco-ships that do appear on the spot charter market will earn a premium but will be unlikely to more generally define vessel earnings until they account for a significantly larger proportion of the market.
42
Table of Contents
“Eco” Design Share of Fleet by Sub-segment, as at June 30, 2019

Vessel propulsion and fueling technology is expected to evolve in the future. However, alternate propulsion technologies are currently immature, and uncertainty hangs over which fuel types are likely to become market standards—or at least credible, and readily available alternates—over the longer term. This uncertainty prompts a wait-and-see approach and is a further brake on the ordering of new ships.
In the meantime, global shipyard capacity has seen consolidation and reduction since the Global Financial Crisis, with the number of active shipyards globally at the end of 2018 down by approximately 65% since the 2007 peak. This process of consolidation is expected to increase the pricing discipline of shipyards, potentially adding upward pressure to newbuild vessel prices.
Number of Active Shipyards by Region, 2007-2018

43
Table of Contents
In addition to deliveries of new ships from the orderbook, various factors influence effective supply (i.e. the carrying capacity of the containership fleet as it is deployed and operated): scrapping, vessel idling, and slow steaming.
Scrapping. From 2000 to 2008, strong markets meant that in aggregate only 300,000 TEU of capacity was scrapped in total across the industry. In 2009, the market downturn led owners to demolish 400,000 TEU that year alone. 2016 was a record year for scrapping, driven by a “right-sizing” of the Panamax fleet with the opening of wider locks in the Panama Canal: across the industry, 670,000 TEU of capacity was demolished, with ‘classic’ Panamax and smaller Post-Panamax vessels representing two thirds of the tonnage scrapped. 409,000 TEU were scrapped in 2017. Scrapping volumes fell to only 119,000 TEU in 2018 against a backdrop of healthier time charter earnings and firming asset values. The first six months of 2019 saw a resurgence in vessel scrapping, with 130,000 TEU demolished. All scrapping activity to date has been focused on the mid-sized and smaller vessel segments and as at June 30, 2019, the largest vessel ever scrapped was 6,627 TEU.
Historical Scrapping Volumes, through June 30, 2019

Furthermore, the regulatory environment continues to evolve in such areas as ballast water treatment and Sulphur emissions. Scrapping activity may be increased in due course if retro-fitting existing vessels for compliance were to imply non-economic capital expenditure, or older and more fuel-hungry vessel designs find themselves at a competitive disadvantage in a higher fuel price environment.
The combination of scrapping and limited newbuilding activity has led to very limited, and in some cases net-negative, fleet growth in most of the mid-size and smaller fleet segments across the industry in recent years.
44
Table of Contents
Net Fleet Growth by Segment, 2016 through June 30, 2019

Vessel Idling. In addition to scrapping capacity, the industry has responded to oversupply by idling vessels. Total idle capacity rose from 70,000 TEU in September 2008 to a peak of over 1.5 million TEU, representing 13.3% of the global fleet, in October 2009. Idle capacity subsequently fell to 110,000 TEU in mid-2011, before peaking again at 840,000 TEU in December 2012. Thereafter, the idle fleet across the industry has expanded and contracted in a cyclical fashion, while generally trending down. Idle fleet capacity at June 30, 2019 was 1.5%.
Evolution of the Idle Fleet, through June 30, 2019
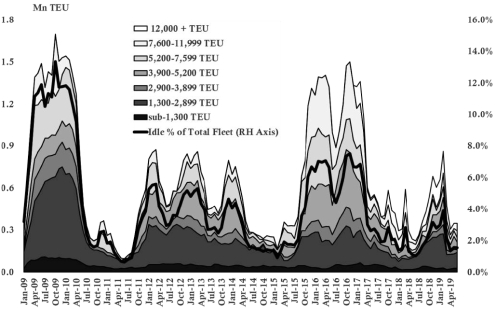
Slow Steaming. Slow steaming has also been a significant factor in restraining effective capacity growth. It was first introduced in 2008 as a response to high fuel prices as the relationship between vessel speed and fuel
45
Table of Contents
consumption is non-linear. Slow steaming typically leads to additional vessels being deployed into an existing service, to maintain a given service frequency, while each vessel steams at a lower speed. It is most easily and effectively applied to longer trades and was pioneered on the Asia-Europe trade.
In 2007, a standard Asia-Europe service was maintained with eight vessels on an eight week rotation. By the end of 2013 eleven and twelve vessel strings, on eleven or twelve week rotations, had become the norm. Today, most services continue to turn in eleven or twelve weeks using eleven to twelve vessels, even as average vessel size has increased. High bunker prices have also seen slow steaming extended to other long distance, high-volume trades such as the Transpacific, Asia-Latin America and Asia-Middle East trades. While the nominal industry-wide capacity of the containership fleet expanded by 34.0% from 2008 to 2012, adjusting for slow steaming reduced this growth rate to 19.0%. Between 2012 and 2018, incremental slow steaming has been relatively limited. However, the service speeds of several Asia-Europe services have already been slowed in 2019, and it is possible that liner companies will use slow steaming more broadly as a response to higher fuel prices following the regulatory changes in January 2020.
Containership Age Profile and Quality by Size Segment
The global containership fleet spans a range of ship sizes. Within each size segment, ships vary by age, specification, and quality.
The weighting of the orderbook towards larger vessels, and comparative under-investment in mid-sized and smaller ships, mean that, on average, ships in the smaller size segments of the containership fleet are significantly older than those in the larger size segments. Approximately 69.0% of the fleet under 2,000 TEU by nominal capacity is more than ten years old and 24.0% is at least 20 years old. The age profile of the small containership fleet is expected to become ‘older’ in the near future. In contrast, no vessel over 10,000 TEU is more than 13 years old; no ship larger than 5,100 TEU is more than 24 years old.
Age Profile of Containership Fleet by Size Segment, as at June 30, 2019

46
Table of Contents
Average Age of Overall Fleet and Average Age of Oldest Quartile of Containership Fleet by Size Segment (Years), as at June 30, 2019

A popular proxy for vessel quality is yard and country of build. Historically (at least until the 2008-09 financial crisis) ships built at Japanese, South Korean, Taiwanese and European yards are considered to be of higher build-quality than those built at Mainland Chinese shipyards. While the gap in build quality has since narrowed, the large number of small and mid-size containerships built before 2008-09 means that this remains an important consideration for a sizeable proportion of the fleet.
Country of Build of Containership Fleet Size by Size Segment, as at June 30, 2019

47
Table of Contents
Another proxy for, and source of, differentiation across vessels is the number of reefer plugs on a vessel, which—along with installed power—determines the number of refrigerated containers that can be carried. As growth in the transport of refrigerated cargoes continues to outpace wider containerized trade growth, liner companies have an incentive to maximise the volume of lucrative reefer cargoes they can carry. This is especially the case on Latin America trade routes. The chart below shows the average number of reefer plugs by vessel size band, alongside the bottom quartile average and the vessel with the highest number of reefer points in each size band. There is clear differentiation between vessels with the highest reefer capacity and the average vessel in each size band.
Reefer Plugs per Vessel of Containership Fleet by Size Segment, as at June 30, 2019

Slot Costs
A fundamental aspect of containership markets is that the relationship between vessel carrying capacity and daily fuel and operating costs is non-linear. This is usually expressed in terms of a vessel’s slot cost, which is the daily cost to a liner company of each loaded container on a ship, assuming the vessel is full.
Ships with identical ‘nominal’ TEU capacities can in practice have different ‘effective’ TEU capacities (calculated on the basis of homogenous loads of 14 mt / TEU) since, all else equal, relatively ‘wide’ vessels exhibit superior stability and so are able to carry a larger number of laden containers than ‘narrower’ vessels. For this reason, ‘widebeam’ (including Post-Panamax) containerships tend to command a premium in terms of time charter rates versus their narrower beam (Panamax and smaller) peers. Similarly, in response to the high fuel price environment in 2013-14 shipyards began to produce more modern ‘Eco’ design containerships, with improved design and more fuel-efficient engines. As ‘Eco’ ships can offer substantial fuel savings relative to ‘Pre-Eco’ vessels of a similar size, they also tend to command both higher time charter earnings and resale values.
48
Table of Contents
Slot costs can be calculated using the following formula, where the cargo-carrying capacity of a vessel is defined as the maximum number of 20 ft containers weighing 14 tons that a ship is able to carry (as opposed to its nominal TEU capacity).
| Fuel Cost | + | Charter Hire | = | Slot Cost ($ per TEU per Day) | ||||
| ($ per Day) | ($ per Day) | |||||||
|
| ||||||||
| Loadable Capacity of Ship (No. TEU @ 14 mt) | ||||||||
The greater the cargo-carrying capacity and fuel-efficiency of a ship, the lower the slot cost. The lower the slot cost, the more attractive a vessel is to liner companies in the charter market. Fuel efficiency is a function of both the size of the vessel and of the design features of an individual vessel. The chart below shows how the relationship between per-slot fuel costs and overall carrying capacity changes as vessel size increases. As vessel size increases, daily fuel costs per slot decrease.
Illustrative Daily Fuel Cost per TEU Slot, by Ship Size

In the chart, the relationship between daily fuel cost per slot and ship size is displayed under two different fuel price scenarios: one where ships consume high-Sulphur bunker fuel that costs an assumed $400/mt, and one where ships burn low-Sulphur bunker fuel oil that costs an assumed $600/mt. Under the higher fuel price scenario the fuel efficiency of larger vessels relative to smaller vessels increases. As fuel costs are expected to increase once new MARPOL Annex VI regulations (IMO 2020) come into force on 1 January, 2020, questions of fuel efficiency and their impact on slot costs will become ever more important to liner companies. Lower fuel costs per slot also translate to lower carbon and related emissions per slot, meaning vessels with lower slot costs will—all else equal—generate lower emissions per-TEU mile.
As shown in the slot cost calculation formula, vessel costs are a function of fuel costs and charter hire. For vessels of different sizes the fuel cost component can be calculated using assumptions about the speed at which vessels are operated (assumed to be 18 knots), the fuel consumption of vessels of different sizes at the assumed operating speed (measured in mt/day), the average time that vessels of different sizes spend at sea, and the price
49
Table of Contents
of fuel in $/mt. For a theoretical vessel of 4,250 TEU this daily fuel cost amounts to around $18,400 per day if the ship is burning high-Sulphur bunker fuel at the assumed cost of $400/mt, and around $27,500 if the ship is burning low-Sulphur bunker fuel at the assumed cost of $600/mt.
As a hypothetical exercise, if it is assumed that the charter hire of a theoretical 4,250 TEU vessel is $10,000 per day then the vessel’s total costs when burning high-Sulphur bunker fuel amount to around $28,400 per day. Assuming that the vessel can carry around 2,800 20 ft containers weighing 14 mt, this produces a daily slot cost of $10.11 per slot.
Slot cost parity is an exercise that explores how time charter rates are affected if daily slot costs across vessels of different sizes are assumed to be equal. For each theoretical vessel, total daily costs are calculated by multiplying the vessel’s carrying capacity by the assumed ‘parity’ daily slot cost (in this exercise $10.11 per slot). If the calculated daily fuel cost for each theoretical vessel (using the methodology described above) is subtracted from this theoretical total cost, the remaining amount is the theoretical charter hire component for each vessel. Put another way, for each vessel this daily time charter rate is the rate that would imply overall slot cost parity with a 4,250 TEU vessel with a daily charter hire of $10,000 per day.
The chart below compares this ‘implied’ slot cost parity time charter rate across different vessel sizes. The economies of scale associated with slot costs explain the greater relative time charter ‘upside’ commanded by larger vessels. Another feature revealed by slot cost parity is that as fuel costs rise, daily time charter rates can also increase for larger vessels while holding slot costs constant. For smaller vessels the implied time charter rate supporting slot cost parity decreases as fuel prices rise.
Daily Time Charter Rate by Vessel Size Implying Overall Slot Cost Parity with 4,250 TEU Panamax, Compared with Indicative Market Time Charter Rate as of June 30, 2019

It must be noted, however, that the potential economies associated with deploying larger vessels can only be unlocked if the utilization levels on those vessels (the percentage of available capacity actually occupied, market share and service frequency on a particular route) are high. Other factors include voyage length (larger vessels
50
Table of Contents
tend to be most cost-efficient on longer trades) and physical constraints (ports need to be sufficiently deep, with appropriate berth length, and equipped with sufficient shore-side infrastructure to handle larger vessels). With these limitations in mind, liner companies look for the lowest possible slot cost on any possible trade, and size vessels accordingly—taking into account total available cargo volume, anticipated market share, and service frequency.
Liner Industry Consolidation
An important development in the sector over the last few years has been a wave of consolidation between liner operators.
Significant recent mergers include: Hapag-Lloyd and CSAV in 2014; Hamburg Süd and CCNI in 2015; COSCON and CSCL (both Chinese state-owned carriers), to form COSCO Shipping, in 2016; CMA CGM and APL in 2016; Hapag-Lloyd and UASC in 2017; Maersk Line and Hamburg Süd in 2017; COSCO Shipping and OOCL in 2018; and the the three major Japanese operators—MOL, NYK Line and K Line—to form Ocean Network Express (ONE) in 2018. This process of consolidation has reduced the number of global operators to eight (from 20, in 2016).
On the Mainlane trades the principal carriers operate in alliances, through which liners combine to operate joint services under vessel sharing arrangements. This allows for a more efficient service network, the offering of a greater range of direct port pairs, and management of capacity. As of 30 June, 2019, there were three alliances operating on the Mainlane trades: the 2M Alliance, the OCEAN Alliance and THE Alliance. Other major liner companies (such as Zim) may cooperate with an alliance on a trade-by-trade basis. Formal alliances do not operate outside of the Mainlane trades, although non-Mainlane trades do see other forms of cooperation between liner companies.
Liner Company Alliance Members

The chart above shows the effects of the pending entry of HMM into THE Alliance. HMM had previously operated a vessel sharing agreement on certain trades with the 2M Alliance, but was not a full alliance member.
51
Table of Contents
As shown in the chart below, each of the alliances—which comprise nine companies in total—will control a larger volume of operating capacity than the aggregate of the remaining 91 out of the top 100 operators (on the basis of the current fleet and orderbook).
Operating Capacity (Existing and On-Order as at June 30, 2019) of the Liner Company Alliances

Containership Leasing
Fully cellular fleet ownership is split between liner companies and charter-owners. Liner companies are logistics service providers. They are responsible for the seaborne transportation of containerized cargo, its handling at load and discharge ports and also often inland transportation between those ports and the container’s origin/destination. While there are more than a hundred liner companies, over 67.0% of fully cellular capacity is controlled by the top five lines and 93.0% of capacity is controlled by the top twenty lines.
Liner companies have increasingly disaggregated vessel operation from vessel ownership. In a highly capital-intensive industry, chartering vessels allows liner companies to outsource their capital requirements while also giving them a platform to flex operating capacity up and down in line with fluctuations in demand. As at June 30, 2019, 55.0% of containership capacity deployed by the top 25 liners was chartered in from containership lessors. 54.0% of the total capacity operated by all liner companies was chartered in. Of the charter-owner fleet, 23.0% is provided by the top five charter-owners and 64.0% by the top 30. In 1995 it has been reported that only 16.0% of the liner fleet was chartered in.
52
Table of Contents
Ownership of Containership Fleet Capacity, June 30, 2019

The chart below shows the fleet and orderbook of the top 25 liner companies, as well as highlighting the percentage of their capacity which is chartered in.
Fleet Profiles of the Top 25 Liner Companies, June 30, 2019

53
Table of Contents
Charter-owners are represented throughout the containership fleet. However, they are particularly prominent in the market for smaller vessels, controlling over half the tonnage in every fleet segment below 3,900 TEU. Overall, the charter-owner fleet totaled over 12.0 million TEU as at June 30, 2019, of which nearly 4.6 million TEU was composed of vessels under 5,100 TEU.
The Charter-owner Fleet by Vessel Size Segment, June 30, 2019

Historically, the German KG system was the principal source of funding for many German shipowners, allowing them to become leading providers of chartered containership tonnage.
A KG is a closed end fund construct broadly analogous to a limited partnership. It has been employed as an investment vehicle for high net worth individuals (primarily German) in various asset classes, including shipping assets. In addition to the returns from their investments, investors in ship-oriented KGs also gain various tax benefits; although since 2005 these tax benefits have been reduced.
However, since 2008 the KG environment for ship investments has been significantly constrained, with limited new capital raised. The resulting retrenchment of German owners—traditionally the providers of mid-sized and smaller tactical tonnage to the sector—has had a significant impact.
The top charter-owners are now far more mixed. However, both in terms of volume and as a percentage of the overall orderbook, the aggregate charter-owner orderbook is low by historic standards. As recently as the beginning of 2015, charter-owners accounted for nearly 70.0% of the outstanding industry-wide orderbook; as at June 30, 2019 the proportion stood at 47.0%.
54
Table of Contents
Fleet Profiles of the Top 30 Charter-Owners, June 30 2019

Contractual Dynamics and Economics of the Containership Leasing (Charter) Market
Liner companies charter vessels in from independent charter-owners. Charters can either be on a time charter or a bareboat basis.
Under a time charter, with the exception of fuel, which is paid for by the lessee, the operating costs of the vessel—including crewing and provisioning, maintenance and repair, lubricating oils and insurances—are borne by the lessor. The lessor must also cover capital expenditures associated with maintaining the vessel, including that for periodic drydocking. Time charters are broadly analogous to wet leases.
Under a bareboat charter, all operating expenses (including fuel) are borne by the lessee. The lessee must also typically cover required capital expenditures on the vessel during the lifetime of the lease. Bareboat charters are effectively financing transactions.
Shipping industry bodies, such as BIMCO (the “Baltic and International Maritime Council”), have developed standard contractual forms as the bases for time charter and bareboat charter agreements. These forms have been widely adopted by the industry.
Time charters tend to be more common than bareboat charters in the containership charter market.
Charter periods can vary in length. The spot market generally refers to charters of 12 months or less. Term charters cover longer fixtures: periods of five years or more are not uncommon. Charters of over seven years tend to be more akin to a financing arrangement than tactical access to tonnage. Charter contracts with international liner operators tend to be denominated in U.S. dollars.
The containership charter market has evolved with the containership fleet, with a liquid charter market only developing for a given vessel size segment once the fleet of vessels on the charter market for that segment reaches a critical mass. This can be driven by charter-owners making speculative orders for the charter market (currently rare), liner companies selling vessels to charter-owners (either outright, or with a charter back), and from ships entering the charter market on expiry of their initial “financing” charters. Consequently, the charter market for the smaller sizes of containerships has a longer pedigree than for larger vessels. Today, there is a
55
Table of Contents
liquid charter market for vessels up to around 8,500 TEU. Although there are larger ships on the charter market, transaction volumes are currently limited.
The volume of containership charter fixtures varies according to the demand for ships and the average length of charter. The chart below shows the evolution of reported containership fixtures. In 2005 and 2006 the total volume of charter fixtures fell as average charter length increased with firm industry conditions. Conversely, fixtures in 2012 reached their highest level ever, in part as a result of shorter charter periods due to the weaker industry conditions but also as a function of the larger charter-owner fleet. 2013 fixtures were estimated to have fallen marginally below 2012 levels, but since then the volume of fixtures activity has remained elevated. Fixture activity in 2017 was especially strong, but fell back in 2018. Fixture activity so far in 2019 has been healthy.
Reported Annual Containership Fixture Activity, through June 30, 2019

56
Table of Contents
Average Length of Containership Fixtures, sub-8,500 TEU Vessels, Q1 1990-Q2 2019

In the spot, or short-term, charter market, rates are driven by the dynamics of supply and demand (see the chart below), which may differ by fleet segment. Generally, when demand growth exceeds supply growth, earnings in the short-term charter market tend to improve. However, this trend can be distorted by additional factors such as slow steaming (which has the effect of reducing effective supply, without being reflected in supply-side growth statistics) and idle capacity (which exacerbates the impact of supply growth). As at June 30, 2019, idle capacity was limited (1.5%), while IMO 2020 is expected to catalyse incremental slow steaming.
57
Table of Contents
Containership Earnings in the Spot Charter Market
are Shaped by Supply and Demand Fundamentals
(2019 and 2020 Data are Forecast Values)

The Containership Spot Market Charter Rate Index used above is calculated using weighted average charter rates of vessels from 10 different fleet segments, with the weighting assigned according to the number of fixtures reported in each vessel size segment in a given year.
58
Table of Contents
Evolution of Containership Time Charter Rates
in the Short-Term Charter Market, through July 31, 2019

Spot market time charter rates have fluctuated since the market trough in Q4 2016. In most cases historically the time charter earnings of vessels of different sizes have moved in tandem, even if the larger vessels in less liquid markets see greater volatility and greater upside, Over the first half of 2019 this normal pattern did not hold, as spot time charter market earnings of larger vessels (above 5,500 TEU) increased strongly while earnings for smaller benchmarks saw little to no gain. This has been partly attributed to the impact of ‘scrubber’ installation prior to the MARPOL regulatory changes on January 1, 2020, which created the need for liner companies to charter in replacement tonnage to replace vessels removed from the fleet to have exhaust cleaning technology installed. As the vessels undergoing these installations tended to be large vessels (larger than 10,000 TEU) liner companies have tried to source relatively large vessels as their replacements. However, it is also illustrative of the finely balanced supply / demand dynamics in these size segments at present.
59
Table of Contents
Panamax and Post-Panamax Time charter Earnings Developments since Q4 2018

Asset Values
Containership newbuilding prices are dictated by the global supply of, and overall demand across all shipping sectors for, shipyard capacity; also the input costs faced by the shipyards themselves (primarily steel, labor, equipment and energy).
The secondhand market for containerships has grown along with the container shipping industry, particularly as charter-owners have increased their share of the fleet, driving an increase in the number of transactions. Secondhand containership sales can either be on a charter-free basis, where the vessel is delivered as-is, or with a charter contract attached. The latter is particularly common when liner companies are selling a vessel: charter-owners often find a sale and leaseback structure attractive for the contracted cash flow during the leaseback period, while liner companies take an asset off their balance sheet and release equity. The economics of such a transaction are negotiated as a function of purchase price, charter rate, charter duration, expected residual value of the vessel and counterparty risk.
Sale and purchase activity within the sector is influenced both by sentiment and by the availability of capital.
60
Table of Contents
Sale and Purchase Transactions for Containerships, by Size of Vessel and by Type of Transaction, through June 30, 2019
| 2017 | 2018 | 2019 | ||||||||||||||||||||||||||||||||||||||||||||||
| Q1 | Q2 | Q3 | Q4 | TOT | Q1 | Q2 | Q3 | Q4 | TOT | Q1 | Q2 | |||||||||||||||||||||||||||||||||||||
| Sales |
68 | 83 | 78 | 66 | 295 | 65 | 51 | 30 | 36 | 182 | 29 | 45 | ||||||||||||||||||||||||||||||||||||
| Resales |
3 | 4 | 0 | 2 | 9 | 1 | 0 | 0 | 0 | 1 | 0 | 0 | ||||||||||||||||||||||||||||||||||||
| 5,100+ TEU |
12 | 14 | 8 | 0 | 34 | 3 | 17 | 5 | 5 | 30 | 7 | 7 | ||||||||||||||||||||||||||||||||||||
| 4,000-5,099 TEU |
7 | 23 | 28 | 12 | 70 | 2 | 8 | 5 | 8 | 23 | 3 | 11 | ||||||||||||||||||||||||||||||||||||
| 2,000-3,999 TEU |
31 | 24 | 19 | 22 | 96 | 17 | 14 | 7 | 3 | 41 | 1 | 7 | ||||||||||||||||||||||||||||||||||||
| 1,000-1,999 TEU |
16 | 17 | 15 | 29 | 77 | 35 | 11 | 9 | 18 | 73 | 12 | 14 | ||||||||||||||||||||||||||||||||||||
| Sub-1,000 TEU |
2 | 5 | 8 | 2 | 17 | 8 | 1 | 4 | 2 | 15 | 6 | 6 | ||||||||||||||||||||||||||||||||||||
| Buyers |
||||||||||||||||||||||||||||||||||||||||||||||||
| German |
3 | 1 | 4 | 4 | 12 | 10 | 8 | 4 | 8 | 30 | 0 | 9 | ||||||||||||||||||||||||||||||||||||
| Greek |
3 | 25 | 4 | 7 | 39 | 9 | 3 | 3 | 10 | 25 | 10 | 6 | ||||||||||||||||||||||||||||||||||||
| Other Tramp |
28 | 46 | 44 | 35 | 153 | 36 | 18 | 21 | 16 | 91 | 12 | 21 | ||||||||||||||||||||||||||||||||||||
| Liner |
34 | 11 | 26 | 19 | 90 | 9 | 22 | 2 | 2 | 35 | 7 | 9 | ||||||||||||||||||||||||||||||||||||
| Sellers |
||||||||||||||||||||||||||||||||||||||||||||||||
| German |
56 | 52 | 53 | 26 | 187 | 20 | 21 | 13 | 11 | 65 | 10 | 21 | ||||||||||||||||||||||||||||||||||||
| Other Tramp |
13 | 18 | 20 | 37 | 88 | 35 | 21 | 12 | 17 | 85 | 10 | 17 | ||||||||||||||||||||||||||||||||||||
| Liner |
2 | 13 | 5 | 2 | 22 | 9 | 2 | 5 | 8 | 24 | 10 | 7 | ||||||||||||||||||||||||||||||||||||
| Total Demo |
53 | 37 | 30 | 21 | 141 | 8 | 5 | 7 | 40 | 60 | 8 | 21 | ||||||||||||||||||||||||||||||||||||
Charter-free containership values between 2003 and 2008 were at elevated levels, driven by strong industry conditions, elevated charter earnings, and high newbuilding prices. However, as the earnings environment deteriorated at the end of 2008, asset values also came under pressure. Since the financial crisis, secondhand prices have—with the brief exception of 2010 and 2011—remained significantly below pre-crisis levels.
The chart below shows the evolution of prices for newbuildings, five year old, ten year-old, fifteen year old and twenty year old vessels, using an unweighted index across vessel sizes from 500 TEU to 13,000 TEU.
61
Table of Contents
Price Index for Newbuild, Five-year-old, Ten year-old,
Fifteen-year-old, and Twenty-year-old vessels (100 = January 2000), through June 30, 2019

As at June 30, 2019, the newbuilding price for a theoretical 3,500 TEU vessel was $42.5 million, down from a 2008 peak of almost $66.0 million, but up from a 2017 trough of $33.5 million. The resale price for a 15 year-old vessel at the same point was a little under $6.1 million, barely distinguishable from scrap value. Despite some recovery from the low-point in resale prices reached in 2016 (where a 15 year-old vessel reached $4.2 million), prices remain low by historic standards and were lower than the previous market peak in September 2018, when prices reached $9.0 million. The chart below shows the evolution of benchmark prices for a 3,500 TEU vessel.
62
Table of Contents
3,500 TEU Vessel Price Benchmarks for Newbuildings,
Existing Tonnage (Five Year Old, 10 Year Old and
15 Year Old Vessels) and Scrap, through June 30, 2019

The resale price of vessels (particularly older units) is also affected by fluctuations in vessel demolition prices. Vessel demolition prices are driven by scrap steel markets in the Indian Subcontinent, where the large majority of vessels are sold for demolition. Demolition prices are volatile, with prices for the first half of 2019 averaging $422 / ldt.
Indian Subcontinent Containership Demolition Prices, $/ldt, January 2000 to June 2019

63
Table of Contents
Another measure of the extent to which industry-wide vessel values are depressed in the current environment is age-adjusted newbuilding price parity. For any given vessel, this can be calculated by taking the newbuilding price prevailing in the market for a vessel with corresponding characteristics, depreciating that price on a straight line basis to scrap, and determining the point on the depreciation line matching the age of the vessel. The chart below illustrates this approach. Depreciation assumptions may vary, inter alia, by vessel type, vessel segment, and analyst.
Implied Newbuilding Price Parity—Based on a 25 Year Depreciation Profile—for Illustrative Five, Ten and 15 Year Old Vessels v. Prevailing Secondhand Market Prices for Those Vessels, Estimated as at June 30, 2019

The charts below show the evolution of, and correlations between, newbuilding prices, second hand asset values, and earnings in the short term charter market over time. The first chart shows long term trends, while the second focuses on developments since the fundamentals-driven recovery commencing early-2017. Both charts also reflect the impact of seasonality and sentiment upon the sector.
64
Table of Contents
Spot Market Time Charter Rate, Newbuild Price
and Secondhand Price Index Development, January 2000 through June 30, 2019

Asset Value and Spot Market Time Charter Rate Development, September 1, 2016 through June 30, 2019

65
Table of Contents
Business Overview
Our legal and commercial name is Global Ship Lease, Inc. We are a Republic of the Marshall Islands corporation that owns a fleet of 41 mid-sized and smaller containerships which we charter out under fixed-rate charters to reputable container shipping companies.
History and Development of the Company
We are a Republic of the Marshall Islands corporation that owns a fleet of mid-sized and smaller containerships which are chartered out under fixed-rate charters to reputable container shipping companies (“liner companies” or “liner operators”).
We were formed in 2007 to purchase and charter back 17 containerships owned or to be purchased by CMA CGM, then the third largest containership operator in the world by number of ships.
On November 15, 2018, we completed a transformative transaction and acquired Poseidon Containers’ 20 containerships, one of which, the Argos, was contracted to be sold, which sale was completed in December 2018, which we refer to herein as the “Poseidon Transaction”. References herein to the “GSL Fleet” are to the 19 ships that were owned by us prior to the consummation of the Poseidon Transaction, and references to the “Poseidon Fleet” are to the 19 ships that we acquired as a result of the Poseidon Transaction, excluding the Argos. On the closing of the Poseidon Transaction, we issued to the Poseidon unitholders 3,005,603 Class A common shares and 250,000 Series C Preferred Shares, which are convertible to an aggregate of 12,955,187 Class A common shares in certain circumstances, and assumed the debt of Poseidon Containers, which amounted to $509.7 million as of November 15, 2018.
Following the announcement of the Poseidon Transaction on October 29, 2018, we have agreed multiple new charters in an improving market over multi-year durations, to renew or replace expiring charters, that have resulted in material improvements to key performance metrics, such as:
| • | Increased remaining contract duration: Since the announcement of the Poseidon Transaction, we have agreed to 27 new charters with an aggregate contract duration of 68 years, resulting in TEU-weighted average remaining contract duration for our entire fleet, as of June 30, 2019 and including subsequent announcements of new charters and options to extend which are under our control, and assuming the mid-point of the redelivery period, of 2.9 years, or 3.3 years also including options to extend which are under the charterers’ control and assuming the latest redelivery date. The charter-attached value of our fleet of 41 vessels as of June 30, 2019 was $1.34 billion. |
| • | Significant new contracted revenue: Since announcing the Poseidon Transaction, we have entered into charters, both as charter renewals and for ship acquisitions, which are expected to generate $511.9 million contracted revenue (measured over the term of the charter to the mid-point of redelivery including options to extend these new charters which are under our control). Contracted future revenue was $835.4 million, as of June 30, 2019 and including subsequent agreements of new charters (assuming the mid-point of redelivery under charters and including options to extend which are under our control). We estimate that our contracted revenue represents 99% of Adjusted EBITDA for 2019, 89% for 2020 and 76% for 2021 on the assumption that ships coming off charter are re-employed at 10 year historical average rates, less 5% commissions. |
In addition, in May 2019, we agreed to acquire three 2004-built 7,849 TEU containerships. Shortly after delivery in May 2019, the first ship, GSL Eleni, commenced a five-year charter with Maersk Line. The second ship, GSL Grania, was delivered in September 2019 and commenced a three-year charter with Maersk Line, with two consecutive one-year extensions at the charterer’s option. The remaining ship, GSL Kalliopi, is expected to be delivered in late September or early October 2019 and upon delivery is scheduled to commence a three-year charter with Maersk Line, with two consecutive one-year extensions at the charterer’s option.
66
Table of Contents
As of the date of this prospectus, we owned 40 containerships and have agreed to acquire one further ship. Following the delivery of this ship, we will own 41 mid-sized and smaller containerships of which nine (representing 31% of our fleet by TEU capacity) are new-design, high-specification, fuel-efficient, and wide-beam. Our fleet, pro forma for the delivery of the remaining vessel we have agreed to acquire, has a total capacity of 224,162 TEU, making us the 13th largest non-operating owner of containerships as of June 30, 2019, according to MSI. Our fleet’s average size is 5,467 TEU, with a TEU weighted average age of 11.9 years.
All of our ships are chartered out on time charters, representing contracted future revenue of $835.4 million as of June 30, 2019, including subsequent new charters and options to extend which are under our control, and assuming the mid-point of redelivery, over a TEU-weighted average remaining term of 2.9 years. Contracted future revenue was $916.4 million on the same basis, but also including options to extend which are under the charterers’ control and assuming the latest redelivery date, over a TEU-weighted average remaining term of 3.3 years. By applying Adjusted EBITDA Margin of 62.2% for the six months ended June 30, 2019 to contracted future revenue, this would imply Contracted Adjusted EBITDA of $519.6 million on our contracted future revenue of $835.4 million (to the mid-point of redelivery and including options to extend charters which are under our control) and $570.0 million on our contracted future revenue of $916.4 million (also including options to extend which are under the charterers’ control and assuming the latest redelivery). Adjusted EBITDA, Adjusted EBITDA Margin and Contracted Adjusted EBITDA are non-U.S. GAAP measures. For a description of Adjusted EBITDA, Adjusted EBITDA Margin and Contracted Adjusted EBITDA and a reconciliation of these measures to net income, the most directly comparable US GAAP financial measure, please see “Summary Financial Data—Non-U.S. GAAP Financial Measures.”
On January 2, 2019, as a consequence of the completion of the Poseidon Transaction, all of our issued and outstanding Class B common shares converted one-for-one into Class A common shares. On March 25, 2019, we effected a one-for-eight reverse stock split of our Class A common shares, which our shareholders authorized at our special meeting of shareholders held on March 20, 2019. There was no change to the trading symbol, number of authorized shares, or par value of our Class A common shares in connection with the reverse stock split. As of June 30, 2019, there were 9,942,950 Class A common shares issued and outstanding, along with 250,000 Series C Preferred Shares, which are convertible into 12,955,187 Class A common shares in certain circumstances. All share and per share amounts disclosed in this prospectus give effect to the reverse stock split retroactively, for all periods presented.
The mailing address of our principal executive office is c/o Global Ship Lease Services Limited, 25 Wilton Road, London SW1V 1LW, United Kingdom, and our telephone number is +44 (0) 20 3998 0063. Our website address is www.globalshiplease.com. The information included on our website is not incorporated herein by reference. From time to time, we may use our website and social media outlets as channels of distribution of material company information.
67
Table of Contents
Our Competitive Strengths.
We believe that we possess a number of competitive strengths that differentiate us and will allow us to capitalize on opportunities in the containership sector, including:
Experienced Management Team. Members of our management team, board of directors and Managers have extensive experience in the container shipping industry and have long-term relationships with companies, individuals and institutions within the wider shipping industry. Our Executive Chairman, George Giouroukos, has more than 25 years of leadership and shipping industry experience, while our Chief Executive Officer, Ian Webber, has 30 years of shipping industry experience, 12 of which serving as our Chief Executive Officer. We believe that we will be able to capitalize on the experience and relationships of our management, board of directors and Managers to identify future acquisitions and charter opportunities beyond those widely and publicly marketed, expand our customer base, and finance these acquisitions and refinance our debt. See “Item 6. Directors, Senior Management and Employees” in our 2018 Annual Report, which is incorporated herein by reference.
Significant Contracted Revenue. All of our ships are chartered out on time charters, representing contracted future revenue of $835.4 million as of June 30, 2019, including subsequent new charters and options to extend which are under our control, and assuming the mid-point of redelivery, over a TEU-weighted average remaining term of 2.9 years. Contracted future revenue was $916.4 million on the same basis, but also including options to extend which are under the charterers’ control and assuming the latest redelivery date, over a TEU-weighted average remaining term of 3.3 years. Our contracted revenue mostly consists of revenue generated by our larger ships as these have higher daily charter rates and longer charter durations provides substantial forward visibility on earnings. Our smaller, lower-earning ships are mostly employed on shorter term contracts, which we believe will provide upside earnings potential in what we anticipate will be a firming charter market after a protracted downturn. Since announcing the Poseidon Transaction, we have entered into charters, both as charter renewals and for ship acquisitions, which are expected to generate $511.9 million contracted revenue (measured over the term of the charter to the mid-point of redelivery including options to extend these new charters which are under our control).
Diversified Portfolio of Charterers. As of June 30, 2019, charterers of our ships included Maersk Line, MSC, COSCO-OOCL, CMA CGM, Hapag-Lloyd and ZIM. In addition, our Commercial Manager has established relationships with, and has previously arranged charters with, many other reputable liner operators, such as ONE, Wan Hai, Evergreen and Seaboard Marine. We expect to continue to capitalize on our senior management’s and Commercial Manager’s long-standing relationships with leading liner companies. We believe that the experience of our senior management team, coupled with our Technical Manager’s extensive experience and reputation, will continue to assist us in securing high employment coverage for our ships to facilitate our future growth.
Focused Fleet Composition. Our fleet is focused on high specification, mid-sized and smaller ships, which we believe are undersupplied in the market and have multiple deployment opportunities. We own and operate 41 containerships, including the ship that will be delivered to us in late September or early October 2019, ranging in size between 2,207 TEU and 11,040 TEU, built at reputable shipyards, with high specifications, and which are well-maintained. Such mid-size and smaller ships are operationally flexible and are core to servicing multiple non-arterial, intermediate, and intra-regional container trades which, in aggregate, represented over 70% of global containerized trade volumes in 2018. Limited investment by the industry in recent years in mid-sized and smaller containerships has resulted in a small orderbook to be delivered over the next two-three years (the orderbook to fleet ratio for 2,000—10,000 TEU ships was 2.6% delivering over the next two to three years as of June 30, 2019, versus an overall ratio of 11.2%) and an aging global fleet, with limited availability of latest-generation ships in these segments.
68
Table of Contents
Fleet with High Technical Specifications. Value-adding attributes that render our ships attractive to our customers, the liner operators, include capacity to carry a large number of temperature-controlled containers (“reefers”), wide-beam and fuel-efficient designs, and onboard cranes (“gear”) for cargo handling. We believe that these features enable our fleet to achieve higher levels of employment and earnings against ships with lower specifications. 72% of our fleet capacity is made up of Post-Panamax containerships larger than 5,500 TEU, which provide enhanced ship stability and thus greater cargo carrying capacity. Cargo carrying capacity is an important selection criterion for liner operators as it reduces slot cost, which is calculated for any given ship as daily fuel cost plus daily charter hire divided by standardized loadable capacity. Nine of our Post-Panamax ships are also latest-generation, fuel efficient “Eco” ships, which further enhance slot cost economics for liner operators and command an earnings premium in the charter market versus non-Eco ships and have the potential to provide longer term charters. Fuel efficiency becomes even more valuable as fuel prices rise, as is anticipated with the introduction of industry-wide emission control regulations from January 2020 (“IMO 2020”), with which the vast majority of ships will comply by burning higher cost, low sulfur fuel. Furthermore, we believe there is a clear correlation between low slot costs and low emissions per TEU, favoring our low slow cost fleet.
Capitalize on Cascade. The shipping industry up-sizes ships over time in order to capture economies of scale by increasing the carrying capacity of ships. This up-sizing is also referred to as the “cascade,” and involves larger ships progressively displacing smaller ships into other trade lanes. Non-mainlane, intermediate, and intra-regional trades are of fundamental importance to global containerized trade – representing, in aggregate, over 70% of global containerized trade volumes in 2018 – and are predominantly served by mid-size and smaller ships, which we believe are supply-constrained. We also believe that our fuel-efficient, low slot cost ships position us to capitalize on cascading opportunities in these markets. As of June 30, 2019, according to MSI, 42.0% of the global fleet (by number of ships) was comprised of ships of 2,000 TEU or smaller, providing significant cascading opportunities for even the smallest ships in our fleet (2,200 TEU).
Efficient Ship Operations. We believe that our Technical Manager’s experience in the technical management of containerships, and their reputation in the shipping industry as operators with high safety and operating standards, are important in servicing our charterers, who depend on reliable ships and responsible containership owning companies to meet their exact and demanding ship scheduling requirements. Our Technical Manager has been managing ships successfully since 1994 and this depth of experience not only provides our customers with a high level of service quality and confidence but also gives us competitive average daily operating costs. Despite significant drydocking of our ships for regulatory surveys and upgrades, utilization for the six months ended June 30, 2019 was 96.9%. Utilization for the three months ended March 31, 2019, which was not affected by elevated levels of drydocking, was 99.8%. In addition, our Technical Manager has experience in upgrading ships, including reefer capacity and fuel efficiency and in the efficient design of scrubbers, all of which raise our ships to higher commercial standards enhancing their marketability and earning capacity.
Growth Track Record. We have a proven ability to grow by purchasing ships with pre-agreed charters that are immediately accretive to cashflow and earnings, while concurrently putting in place competitively-priced and conservatively-structured debt to facilitate such growth. Our Executive Chairman, George Giouroukos, has structured and concluded over 250 secondhand and newbuilding ship transactions. The strategic combination between GSL and Poseidon Containers in November 2018 also demonstrates our capacity to successfully execute transformative corporate transactions. We believe that our senior management team’s extensive knowledge of, and contacts within, the container shipping industry will allow us to continue to add value-accretive ships and charters to our portfolio.
Multiple Financing Sources. Access to cost-effective capital is important in the container shipping industry. As a publicly listed company with a business model primarily oriented towards providing medium-term
69
Table of Contents
charters to reputable counterparties, we can potentially access equity and debt markets, both private and public, on a recurrent basis. In a capital-constrained environment, we believe that being a publicly listed company with a high level of transparency and reporting is an advantage in competing with other containership owning companies, which are predominantly private and do not have access to such diverse sources of capital. In addition, our management team has extensive and long-standing relationships with commercial banks that provide us with access to the traditional secured loan bank market. Specifically, since the Poseidon Transaction, our significantly expanded banking relationships now include Citi, Credit Agricole, Deutsche Bank, ABN Amro, DVB, CIT, Entrust, ATB and Hellenic Bank.
Our Business Strategies
Our primary objective is to maximize value for our shareholders by pursuing the following strategies:
Maintain Fleet Focus. We intend to maintain our focus on containerships of 2,000 – 11,000 TEU, weighted towards wide-beam, high-reefer, fuel-efficient ships of 5,500 – 10,000 TEU. We believe the cost-return characteristics of ships in this size segment are attractive. Specifically, they are sought after by charterers given their operational flexibility and low slot costs and should thereby allow us to manage our fleet deployment effectively, locking in upside earnings potential for shareholders by securing longer-term charters generating contracted cashflows. Furthermore, due to scarce capital being disproportionately allocated to the construction of the largest containerships for the main East-West trades lanes, such as Asia – Europe, the order-book for containerships below 10,000 TEU is at historically low levels and, according to MSI, there are no ships on order in our area of focus, the 4,000 TEU and 9,999 TEU segment, which, combined with reasonable demand growth for container shipping services, particularly in the trade lanes where our ships are best deployed, is expected to result in continuing improvements in charter rates and hence asset values, over time. We expect supply to tighten further for these ship segments with the implementation on January 1, 2020 of the new industry-wide emission controls under IMO 2020, which we believe may prompt liner operators to slow down their ships in order to reduce fuel burn and thus costs, reducing effective supply.
Optimize Charter Portfolio. We intend to proactively manage our portfolio of charters to lock in upside earning potential, while also providing downside protection through charter cover. This provides significant forward visibility of stable cashflows, while preserving the flexibility to capitalize on potentially rising charter rates. We currently charter most of our high revenue producing ships under medium term time charters of between three to five years, with staggered maturities, while the remainder of the fleet, mostly our smaller ships, are on shorter term charters of less than 12 months to position us to benefit from market increases in charter rates. Additionally, we will continue to charter our ships to reputable charterers, such as our long-standing clients Maersk Line, MSC, COSCO-OOCL, CMA CGM, Hapag Lloyd and ZIM, and will continue to expand the number of leading liner companies chartering our ships in order to further diversify our portfolio of charters from customer, geographic and maturity perspectives.
Moderate Leverage Level and Reduced Cost of Debt. Our mandatory debt repayment profile will result in substantial debt reduction over the next few years. We believe that reducing our leverage and maintaining debt at a moderate level will enable us to reduce our overall cost of debt, enhance our financial flexibility and allow us to make opportunistic acquisitions consistent with our strategy. We expect to finance future ship acquisitions, with cash on hand, borrowings under new credit facilities, or subject to favorable market conditions, public debt or equity offerings, or a combination thereof.
Implement Disciplined Growth. We intend to continue to grow and renew our fleet mainly by acquiring second-hand containerships with high specifications and fuel efficiency, that are already employed on charters or that can be so employed immediately following their acquisition, as market conditions allow. When evaluating these future acquisitions, we will consider, among other things, fundamental developments in the container shipping industry, the value of the ship compared to historical levels, the cash flow expected to be earned by the ship in relation to its value, the credit quality of the charterer and duration and terms of charter contracts, its
70
Table of Contents
condition and technical specifications, as well as the overall diversification of our fleet and customer portfolio. We believe that attractive, counter-cyclical investment opportunities are available in the market. These may include both structured sale and leaseback transactions with liner companies and the acquisition of selected, attractively-priced ships, in the sale and purchase market. In addition, we will evaluate and consider strategic corporate acquisitions on a selective and prudent basis.
Leverage Our Managers’ Experience. We intend to leverage our Technical Manager’s expertise to continue to manage our ships efficiently and reliably at a low daily operating cost, as well as support future growth. We believe that our Technical Manager is able to oversee the technical management of our fleet at a cost than is lower than we could achieve in-house and which is competitive compared to other independent ship management companies. Additionally, we believe that our outsourced management arrangements provide scalability to facilitate growth without the incurrence of significant additional overheads. In addition, our Technical Manager has experience in upgrading the reefer capacity and fuel efficiency of ships, and in the efficient design of scrubbers, as well as other characteristics that raise our ships to higher commercial standards enhancing their marketability and earning capacity. Moreover, our Commercial Manager has direct relationships with liner companies as evidenced by multiple long-term contracts, including repeat business, secured since the completion of the Poseidon Transaction.
Our Fleet
The following table summarizes key information about our fleet of 41 containerships as of September 16, 2019:
| Ship Name | Capacity in TEUs |
Lightweight (tons) |
Year Built |
Charterer | Earliest Charter |
Latest Charter |
Daily Charter Rate $ |
|||||||||||||||||||
| CMA CGM Thalassa |
11,040 | 38,577 | 2008 | CMA CGM | 4Q25 | 1Q26 | 47,200 | |||||||||||||||||||
| UASC Al Khor(1) |
9,115 | 31,764 | 2015 | Hapag-Lloyd | 1Q22 | 2Q22 | 34,000 | |||||||||||||||||||
| Anthea Y(1) |
9,115 | 31,890 | 2015 | COSCO | 2Q20 | 3Q20 | 39,200 | |||||||||||||||||||
| Maira XL(1) |
9,115 | 31,820 | 2015 | COSCO | 2Q20 | 3Q20 | 39,200 | |||||||||||||||||||
| MSC Tianjin |
8,667 | 34,243 | 2005 | MSC | 2Q24 | 3Q24 | (2) | — | (2) | |||||||||||||||||
| MSC Qingdao |
8,667 | 34,305 | 2004 | MSC | 2Q24 | 3Q24 | (2) | — | (2) | |||||||||||||||||
| GSL Ningbo |
8,667 | 34,243 | 2004 | Maersk | 3Q20 | 3Q20 | 12,400 | (3) | ||||||||||||||||||
| GSL Kalliopi |
7,849 | 29,245 | 2004 | Maersk | 3Q22 | 4Q24 | (4) | — | (4) | |||||||||||||||||
| GSL Grania |
7,849 | 29,261 | 2004 | Maersk | 3Q22 | 4Q24 | (4) | — | (4) | |||||||||||||||||
| GSL Eleni |
7,849 | 29,261 | 2004 | Maersk | 2Q24 | 3Q24 | (4) | — | (4) | |||||||||||||||||
| Mary(1) |
6,927 | 23,424 | 2013 | CMA CGM | 3Q23 | 4Q23 | 25,910 | |||||||||||||||||||
| Kristina(1) |
6,927 | 23,424 | 2013 | CMA CGM | 2Q24 | 3Q24 | 25,910 | |||||||||||||||||||
| Katherine(1) |
6,927 | 23,424 | 2013 | CMA CGM | 1Q24 | 2Q24 | 25,910 | |||||||||||||||||||
| Alexandra(1) |
6,927 | 23,424 | 2013 | CMA CGM | 1Q24 | 2Q24 | 25,910 | |||||||||||||||||||
| Alexis(1) |
6,882 | 23,919 | 2015 | CMA CGM | 1Q24 | 2Q24 | 25,910 | |||||||||||||||||||
| Olivia I(1) |
6,882 | 23,864 | 2015 | CMA CGM | 1Q24 | 2Q24 | 25,910 | |||||||||||||||||||
| CMA CGM Berlioz |
6,621 | 26,776 | 2001 | CMA CGM | 2Q21 | 4Q21 | 34,000 | |||||||||||||||||||
| Agios Dimitrios |
6,572 | 24,746 | 2011 | MSC | 3Q19 | 4Q23 | 12,500 | (5) | ||||||||||||||||||
| Tasman |
5,936 | 25,010 | 2000 | ZIM | 3Q19 | 3Q19 | (6) | 11,500 | (6) | |||||||||||||||||
| Dimitris Y |
5,936 | 25,010 | 2000 | ZIM | 3Q19 | 3Q19 | (7) | 16,750 | (7) | |||||||||||||||||
| Ian H |
5,936 | 25,128 | 2000 | ZIM | 1Q21 | 2Q21 | 14,500 | |||||||||||||||||||
| Dolphin II |
5,095 | 20,596 | 2007 | HMM | 3Q19 | (8) | 4Q19 | (8) | 7,700 | (8) | ||||||||||||||||
| Orca I |
5,095 | 20,696 | 2006 | Maersk | 2Q20 | (9) | 2Q21 | (9) | 9,000 | (9) | ||||||||||||||||
| CMA CGM Alcazar |
5,089 | 20,087 | 2007 | CMA CGM | 4Q20 | 2Q21 | 33,750 | |||||||||||||||||||
| CMA CGM Château d’If |
5,089 | 20,100 | 2007 | CMA CGM | 4Q20 | 2Q21 | 33,750 | |||||||||||||||||||
| CMA CGM Jamaica |
4,298 | 17,272 | 2006 | CMA CGM | 3Q22 | 1Q23 | 25,350 | |||||||||||||||||||
| CMA CGM Sambhar |
4,045 | 17,355 | 2006 | CMA CGM | 3Q22 | 1Q23 | 25,350 | |||||||||||||||||||
| CMA CGM America |
4,045 | 17,355 | 2006 | CMA CGM | 3Q22 | 1Q23 | 25,350 | |||||||||||||||||||
71
Table of Contents
| GSL Valerie |
2,824 | 11,971 | 2005 | MSC | 2Q20 | 3Q20 | 9,000 | |||||||||||||||||||
| Athena |
2,762 | 13,538 | 2003 | MSC | 1Q20 | 2Q20 | 9,000 | |||||||||||||||||||
| Maira |
2,506 | 11,453 | 2000 | MSC | 3Q19 | 3Q19 | 8,500 | (10) | ||||||||||||||||||
| Nikolas |
2,506 | 11,370 | 2000 | MSC | 1Q20 | 1Q20 | 9,000 | |||||||||||||||||||
| Newyorker |
2,506 | 11,463 | 2001 | MSC | 1Q20 | 1Q20 | 9,000 | |||||||||||||||||||
| CMA CGM La Tour |
2,272 | 11,742 | 2001 | CMA CGM | 4Q19 | 4Q19 | 15,300 | |||||||||||||||||||
| CMA CGM Manet |
2,272 | 11,742 | 2001 | CMA CGM | 15,300 | |||||||||||||||||||||
| CMA CGM Matisse |
2,262 | 11,676 | 1999 | CMA CGM | 15,300 | |||||||||||||||||||||
| CMA CGM Utrillo |
2,262 | 11,676 | 1999 | CMA CGM | 3Q19 | 3Q19 | 15,300 | (11) | ||||||||||||||||||
| GSL Keta |
2,207 | 11,731 | 2003 | ANL | 3Q19 | 3Q19 | 8,450 | (12) | ||||||||||||||||||
| GSL Julie |
2,207 | 11,731 | 2002 | CMA CGM | 3Q19 | 4Q19 | 7,200 | (13) | ||||||||||||||||||
| Kumasi |
2,207 | 11,731 | 2002 | CMA CGM | 4Q19 | 1Q21 | (14) | 9,800 | (14) | |||||||||||||||||
| Marie Delmas |
2,207 | 11,731 | 2002 | CMA CGM | 4Q19 | 1Q21 | (14) | 9,800 | (14) |
| (1) | Modern design, high reefer capacity fuel efficient ships. |
| (2) | Five year charter to MSC at implied Adjusted EBITDA of $25.6 million per ship for the period. |
| (3) | Charterer has exercised the option to extend 12 months from September 21, 2019 at $18,000 per day. |
| (4) | GSL Eleni delivered in May 2019; GSL Grania delivered in September 2019 and GSL Kalliopi is scheduled to be delivered in late September or early October 2019. GSL Eleni chartered for five years; GSL Grania and GSL Kalliopi are or will be chartered for three years plus two successive periods of one year at option of the charterer. Implied Aggregate Adjusted EBITDA of $32.0 million for firm periods, increasing to $47.0 million if all options are exercised. |
| (5) | Thereafter , we have the option, callable in 4Q19, to extend for four years at $20,000 per day. |
| (6) | Thereafter, a new charter with Maersk Line for 30—38 months at an implied Adjusted EBITDA of $5.3 million for the median period. Additional 12—month extension at charterer’s option, for an additional $4.4 million implied Adjusted EBITDA. |
| (7) | Thereafter in direct continuation 21-24 months to ZIM at $14,500 per day. |
| (8) | Rate increases to $11,500 per day from August 14, 2019. |
| (9) | Rate increases to $10,000 per day from June 3, 2020. |
| (10) | Thereafter, 6-7 months to MSC at $8,250 per day. |
| (11) | Thereafter, 6-7 months to CMA CGM at $8,500 per day. |
| (12) | Thereafter 50-90 days to OOCL at $8,700 per day. |
| (13) | $ 7,200 per day between August 16, 2019 and October 16, 2019, at charterer’s option, with an option in favor of charterer to extend from October 16, 2019 at $8,500 per day for six months plus or minus 30 days. |
| (14) | We have has the option to extend to December 31, 2020 plus or minus 90 days, at $9,800 per day. |
Employment of Our Fleet
We employ the ships in our fleet on time charters. A time charter is a contract for the use of a ship for a fixed period of time at a specified daily rate. Under a time charter, the ship owner provides and bears the cost of crew, lubricating oil and all maintenance and other services related to the ship’s operation, the cost of which is recovered from the daily charter rate. As ship owner, we are also responsible for insuring our interests in the ship and liabilities as owner arising from its use. The charterer is responsible for substantially all of the ship’s voyage costs, such as fuel (bunker) costs, canal fees, port expenses, cargo handling costs and extra war risk insurance costs if the ship is deployed outside normal insurance limits and enters areas which are specified by the insurance underwriters as being subject to additional premiums.
The term for a time charter commences on the ship’s delivery to the charterer. Time charter agreements may include options, in favor of the owner or the charterer, to extend the charter on pre-agreed terms. Charters may be extended on mutually agreed terms, or the ship may be re-delivered by the charterer at the end of the charter period, within a pre-agreed time window (to allow for operational flexibility), in which case we would seek alternate employment with another charterer.
72
Table of Contents
Our charters are with a number of different charterers and expire on different dates over a period of time. We believe the diversified charterer base reduces counterparty risk and the staggered expirations of our charters reduces our exposure to rechartering risk and may mitigate the impact of the cyclical nature of the container shipping industry.
Daily Charter Rate
Daily charter rate refers to the gross amount per day payable by the charterer to the owner for the use of the ship. It may be reduced by chartering commission payable to a broker or other party. Under our time charters, hire is payable to us typically every 15 days in advance and in U.S. dollars. The daily charter rate is a fixed daily amount that will remain the same for the relevant period of the charter, although the charter rate can be reduced in certain circumstances where there are added costs to the charterer due to ship performance deficiencies in speed or fuel consumption. Hire can also be reduced, pro-rata for any cost savings that we may realize, if the ship is laid up or idled at the charterers’ request.
Operations and Expenses
As owners, we are required to maintain each ship in class and in an efficient state of hull and machinery and are responsible for ship costs such as crewing, lubricating oil, maintenance, insurance and drydocking. The charterer is responsible for the voyage costs, which includes bunker fuel, stevedoring, port charges and towage. As described below, we have entered into ship management agreements to sub-contract the day-to-day technical management of our ships.
Right of First Refusal
Pursuant to the terms of the initial time charters with CMA CGM, of which 13 are in place as of the date of this prospectus, CMA CGM has a right of first refusal to purchase the ship at matching terms to any offer of any third party if we decide to sell it during, or at the end of, the charter period. Should CMA CGM decline to exercise its right of first refusal in case of a sale during the charter period, we will be entitled to sell the ship, subject to CMA CGM’s prior approval, which shall not be unreasonably withheld. CMA CGM has the right to reject a sale of a ship to owners whose business or shareholding is determined to be detrimental or contrary to its interest.
Off-hire
Under a time charter, when the ship is not available for service, and is “off-hire,” the charterer generally is not required to pay charter hire (unless the charterer is responsible for the circumstances giving rise to the ship’s unavailability), and we are responsible for costs during any off-hire period, and possible additional costs of fuel to regain lost time. A ship generally will be deemed to be off-hire if there is an occurrence that affects the full working condition of the ship, including:
| • | any drydocking for repairs, maintenance or classification society inspection; |
| • | any damage, defect, breakdown or deficiency of the ship’s hull, machinery or equipment or repairs or maintenance thereto; |
| • | any deficiency of the ship’s master, officers and/or crew, including the failure, refusal or inability of the ship’s master, officers and/or crew to perform the service immediately required, whether or not within its control; |
| • | its deviation, other than to save life or property, which results in the charterer’s lost time; |
| • | crewing labor boycotts or certain ship arrests; or |
| • | our failure to maintain the ship in compliance with the charter’s requirements, such as maintaining operational certificates. |
73
Table of Contents
Ship Management and Maintenance
Under each of our time charters, we are responsible for the operation and technical management of each ship, which includes crewing, provision of lubricating oils, maintaining the ship, periodic drydocking and performing work required by regulations. The day-to-day crewing and technical management of our ships are provided by Technomar, our Technical Manager, pursuant to the terms of ship management agreements.
Termination and Withdrawal
Generally, if a ship is off-hire for a significant number of consecutive days, then the charterer may cancel the charter without any further consequential claims provided the ship is free of cargo. The number of these days varies from 20 to 90 days and depends on the relevant charter agreement. Some of our charters provide that we can in some circumstances provide a substitute ship during an anticipated extended period of off-hire.
For a number of ships chartered to CMA CGM, if a ship’s fuel consumption exceeds a level specified in the charter over a continuous period of 30 days, and the reason is within our or the ship’s control, CMA CGM may request that we cure the deficiency. If the deficiency is not cured within 30 days after we receive notice, then CMA CGM may terminate the charter. OOCL does not have a similar right.
Generally, if either party informs the other party of a default under the charter, and the default is not rectified within 60 days of such notice, then the party giving the notice has the right to terminate the time charter with respect to that ship.
The charter will terminate in the event of a total (actual or constructive) loss of the ship or if the ship is requisitioned.
We may suspend the performance of our obligations under the charter if the charterer defaults on its payment obligations under the charter.
Ship Management
For details regarding the technical and commercial management of our ships, please see “Item 4. Information on the Company—B. Business Overview—Ship Management” and “—Commercial Management” in our Annual Report on Form 20-F for the year ended December 31, 2018, which is incorporated herein by reference.
Insurance
We arrange for insurance coverage for each of our ships, including hull and machinery insurance, protection and indemnity insurance and war risk insurance. We are responsible for the payment of all premiums. For more information regarding our insurance coverage, please see “Item 4. Information on the Company—B. Business Overview—Risk of Loss and Liability Insurance” contained in our Annual Report on Form 20-F for the year ended December 31, 2018, which is incorporated herein by reference.
Inspection by Classification Societies
For details regarding inspection and classification of our ships, please see “Item 4. Information on the Company—B. Business Overview—Inspection by Classification Societies” contained in our Annual Report on Form 20-F for the year ended December 31, 2018, which is incorporated herein by reference.
Competition
We operate in markets that are highly competitive. We expect to compete for ship purchases and charters based upon price, customer relationships, operating expertise, professional reputation and size, age and condition
74
Table of Contents
of the ship. We also expect to compete with many other companies, both other owners and operators including CMA CGM and its subsidiaries, to, among other things, purchase newbuildings and secondhand ships to grow our fleet.
We expect substantial competition in obtaining new containership charters from a number of experienced and substantial companies. Many of these competitors may have greater financial resources than us, may operate larger fleets, may have been established for longer and may be able to offer better charter rates. Due to the recent container shipping industry downturn, there have been an increased number of ships available for charter, including many from owners with strong reputations and experience. Excess supply of ships in the container shipping market results in a more active short-term charter market and greater price competition for charters. As a result of these factors, we may be unable to purchase additional containerships, expand our relationships with existing customers or obtain new charterers on a profitable basis, if at all, which would have a material adverse effect on our business, results of operations and financial condition.
Permits and Authorizations
We are required by various governmental and other agencies to obtain certain permits, licenses and certificates with respect to our ships. The kinds of permits, licenses and certificates required depend upon several factors, including the commodities transported, the waters in which the ship operates, the nationality of the ship’s crew and the age of a ship. Not all of the permits, licenses and certificates currently required to operate the ships globally have been obtained by us or our Managers beforehand, they will be obtained in cases voyage requires it to operate them in these waters.
Environmental and Other Regulations
Government regulation significantly affects our business and the operation of our ships. For details regarding the environmental and government regulations affecting our business, please see “Item 4. Information on the Company—B. Business Overview -Environmental and Other Regulations” in our 2018 Annual Report and incorporated herein by reference.
Legal Proceedings
We have not been involved in any legal proceedings that may have, or have had a significant effect on our business, financial position, results of operations or liquidity, and we are not aware of any proceedings that are pending or threatened that may have a material adverse effect on our business, financial position, results of operations or liquidity. From time to time, we may be subject to legal proceedings and claims in the ordinary course of business, principally personal injury and property casualty claims associated with operating containerships. We expect that these claims would be covered by insurance, subject to customary deductibles. Claims, even if lacking merit, could result in the expenditure of significant financial and managerial resources.
Exchange Controls
We are not aware of any governmental laws, decrees or regulations in the Republic of The Marshall Islands that restrict the export or import of capital, including foreign exchange controls, or that affect the remittance of dividends, interest or other payments to non-resident holders of our securities.
Properties
Other than our ships, we do not own any material property. Please see “Item 4. Information on the Company B. Business Overview—Our Fleet” for a description of our ships. Our ships serve as collateral under our debt agreements. For further information regarding our debt agreements and the security thereunder, please see “Item 5. Operating and Financial Review and Prospects—B. Liquidity and Capital Resources—Indebtedness” contained in our 2018 Annual Report and incorporated herein by reference. We do not own any real property.
75
Table of Contents
Directors and Senior Officers
Our directors and executive officers as of the date of this prospectus and their ages as of the date of this prospectus are listed below:
| Name |
Age | Position | ||||
| George Giouroukos |
54 | Executive Chairman | ||||
| Michael S. Gross |
58 | Director | ||||
| Alain Wils |
76 | Director | ||||
| Philippe Lemonnier |
59 | Director | ||||
| Michael Chalkias |
49 | Director | ||||
| Henry Mannix III |
40 | Director | ||||
| Alain Pitner |
70 | Director | ||||
| Menno van Lacum |
49 | Director | ||||
| Ian J. Webber |
62 | Chief Executive Officer | ||||
| Thomas A. Lister |
50 | Chief Commercial Officer | ||||
| Anastasios Psaropoulos |
41 | Chief Financial Officer | ||||
George Giouroukos: Mr. Giouroukos has been our Executive Chairman since November 2018 when the strategic combination with Poseidon Containers was completed. He has been involved in Shipping since 1993, when he joined a major Greek shipowning company and worked in various departments. He founded Technomar, an internationally recognized ship management company, in 1994, where he has served as Managing Director. With over 25 years of experience in the sector, he has negotiated and executed over 200 secondhand and newbuilding ship transactions, creating partnerships with a number of major shipping banks resulting in co-investment of approximately $230 million in workout transactions. He has also partnered with Private Equity firms to jointly invest in container and dry bulk ships. Mr. Giouroukos serves as the Chairman of the Hellenic Advisory Committee of International classification society, RINA and holds a Bachelor in Mechanical Engineering from University College London and a Master in Engineering from Brunel University.
Michael S. Gross: Mr. Gross has been a director since inception and was Chairman from September 2008 to November 2018 when the strategic combination with Poseidon Containers closed. Since 2010, Mr. Gross has been the Chairman of the board of directors and Chief Executive Officer of Solar Senior Capital Ltd. Since 2007, Mr. Gross has served as the Chairman and Chief Executive Officer of Solar Capital Ltd, a finance company focusing on debt and equity investments in leveraged companies. From 2004 to 2006, Mr. Gross was the President and Chief Executive Officer of Apollo Investment Corporation (“AIC”), a publicly traded business development company, and was the managing partner of Apollo Investment Management, L.P. (“AIM”), the investment adviser to AIC. From 1990 to 2006 Mr. Gross was a senior partner of Apollo Management, a leading private equity firm which he co-founded in 1990.
Alain Wils: Mr. Wils has been a director since May 2014. He is a consultant in the shipping and logistics industries, after more than 40 years of experience in the sector. Mr. Wils joined the CMA CGM group in 1996 as managing director of the previously state-owned shipping company, CGM, on its acquisition by CMA. He was appointed an executive board member of CMA CGM in 2001 on the merger of CMA and CGM until his retirement in 2008. From 1992 to 1996, he was chairman and CEO of Sceta International, later renamed Geodis International, a leading European logistics and freight forwarding company. He was the managing director of the shipping group Delmas Vieljeux, which he joined in 1971, from 1982 to 1992. Mr. Wils, who is a graduate of HEC Paris and of Paris University, was appointed Chevalier de la Légion d’Honneur in 1995 and chaired the French Shipowners’ Association from 1998 to 2000.
Philippe Lemonnier: Mr. Lemonnier has been as director since September 2017. He currently serves as Vice President Group Performance Control at CMA CGM group. Previously he was Global Head of Efficiency
76
Table of Contents
Programs at CEVA Logistics, also responsible for Procurement and the Margin Improvement Program. He has served as Group Financial Controller and in charge of the Agility Program (cost savings program) at CMA CGM, having joined the company in 2005. He has more than 30 years of experience in finance and accounting, and has served in senior leadership roles across multiple industries, including as the Chief Financial Officer of two French telecommunications companies.
Michael Chalkias: Mr. Chalkias has been a director since November 2018 when the strategic combination with Poseidon Containers was completed. He is the Co-founder of Prime Marine, a leading international product tanker and gas carrier company, which has managed more than 95 ships since its inception, where he serves as Co-Chief Executive Officer. Since March 2018, Mr. Chalkias has also served as non-executive, non-independent director of First Ship Lease Trust (“FSL Trust”), a Singapore-based business trust listed on the Mainboard of the Singapore Exchange Securities Trading Limited. FSL Trust currently owns a diversified portfolio of 18 ships. Mr. Chalkias has more than 25 years of experience in the shipping industry, during which he has accumulated broad experience in all aspects of the business and established strong relationships in the shipping industry. Prior to co-founding Prime Marine’s predecessor in 1999, he was employed by Tufton Oceanic Limited, a specialized shipping finance and investment firm in London, where he was involved with debt and equity instruments as well as structured financing. Over the course of his career, Mr. Chalkias has invested in many ships, primarily product tankers and gas carriers. Mr. Chalkias holds an MSc with Distinction in Shipping, Trade & Finance from the Cass Business School at the City University of London and a BSc with Honors in Maritime Business and Maritime Law from the University of Plymouth.
Henry (Hank) Mannix III: Mr. Mannix was appointed a director in November 2018. He has served as a director of Poseidon Containers since 2010. Mr. Mannix joined Kelso in 2004 and became a Managing Director in 2015. He spent the preceding two years in the investment banking division of Credit Suisse First Boston. Mr. Mannix is also a director of Elara Caring, Physicians Endoscopy and The Traxys Companies. Mr. Mannix received a B.A. in Math and Economics from the College of the Holy Cross in 2001. Mr. Mannix has extensive experience in corporate financing and in evaluating the financial performance and operations of companies across a variety of business sectors, including the shipping sector.
Alain Pitner: Mr. Pitner, who has 30 years of shipping experience, was appointed a director in November 2018. Mr. Pitner commenced his career in 1974 in the Risk Department of Banque Indosuez, now part of Credit Agricole Group. He held various operational and commercial responsibilities in the Bank’s French Export Credit Department. In 1987, Mr. Pitner joined the Shipping Division of the Bank’s Structured Finance Department, where he financed newbuildings and was also responsible for special projects. He then was entrusted with increasingly senior roles. In September 2017, after 42 years, Mr. Pitner retired from the bank. He graduated from Reims business school and holds a MSIA from Krannert Business School—Purdue University, USA.
Menno van Lacum: Mr. van Lacum was appointed a director in November 2018 and commenced his career in 1997 at the Fortis Group in the Netherlands. In 1999, he joined the Transportation Group at MeesPierson where he was responsible, in different capacities, for arranging and structuring debt capital markets and leasing products predominantly for the Transportation Equipment Leasing sector. In 2005, Mr. van Lacum became Director of the Fortis Principal Finance Group in the USA, responsible for holding equity investments and structuring debt instruments across different asset classes within the Transportation Sector. In 2009, Mr. van Lacum joined the Transportation Capital Group (“TCG”) as a Partner in the Netherlands. TCG is a private investment firm focusing primarily on the shipping industry. Mr. van Lacum holds a Master’s Degree in Economics from the University of Amsterdam, Netherlands.
Ian J. Webber: Mr. Webber has been our Chief Executive Officer since August 2008. From 1979 to 1996, Mr. Webber worked for PriceWaterhouse, the last five years of which he was a partner. From 1996 to 2006, Mr. Webber served as the Chief Financial Officer and a director of CP Ships Limited, a containership operator and subsidiary of Canadian Pacific Limited until 2001 and thereafter a public company listed on the New York and Toronto stock exchanges until its acquisition by TUI A.G. in 2005. Mr. Webber is a graduate of Cambridge University.
77
Table of Contents
Thomas A. Lister: Mr. Lister has been our Chief Commercial Officer since August 2008 and, from April 2017 to November 2018, was also our Chief Financial Officer. From 2005 until 2007, Mr. Lister was a Senior Vice President at DVB. Before that, from 2004 to 2005, he worked for the German KG financier and ship owning group, Nordcapital & E.R.Schiffahrt, as Director of Business Development. From 1991 to 2002, Mr. Lister worked in a number of managerial, strategic and operational roles in international shipping groups. Mr. Lister graduated from Durham University and holds an MBA from INSEAD.
Anastasios Psaropoulos: Mr. Psaropoulos became our Chief Financial Officer in November 2018. He has over 12 years of experience in finance in the shipping sector. He has served as Chief Financial Officer of Poseidon Containers and Technomar, which he joined in 2011, participating in a number of successful distressed assets acquisitions. Prior to Poseidon, he was financial controller in Dolphin Capital, an AIM listed real estate development fund. He has also worked as an external auditor with PricewaterhouseCoopers, covering shipping and oil & gas industries. Mr. Psaropoulos holds a Master in Economics with specialization in Finance and Investments, from the Athens University of Economics and Business. He has also participated in the Program for Leadership Development (PLDA) of Harvard Business School.
From November 2008 until the completion of the Poseidon Transaction in November 2018, Vivek Puri was our Chief Technical Officer. His employment ended in April 2019.
From August 2008 to March 2017, Susan J. Cook was our Chief Financial Officer. From April 2017 to February 2019, she was a part-time advisor to the company.
Board of Directors and Executive Compensation
For information regarding employment agreements and executive and director compensation, please see “Item 6. Directors, Senior Management and Employees—B. Compensation” contained in our 2018 Annual Report, incorporated by reference herein, and our Report on Form 6-K, filed with the Commission on August 9, 2019, incorporated by reference herein.
Board Practices
For details regarding our board practices, including information regarding board committees, please see “Item 6. Directors, Senior Management and Employees—C. Board Practices” in our 2018 Annual Report and incorporated herein by reference.
Employees
As of August 30, 2019, we had six employees and as of December 31, 2018, we had 12 employees. At each of December 31, 2017 and 2016, we had nine employees.
78
Table of Contents
CERTAIN RELATIONSHIPS AND RELATED PARTY TRANSACTIONS
Registration Rights Agreement
At the time of the Marathon Merger, we entered into a registration rights agreement with CMA CGM, Marathon Investors, LLC, Marathon Founders, LLC and the other initial shareholders of Marathon common stock (including Michael S. Gross), pursuant to which we agreed to register for resale on a registration statement under the Securities Act of 1933, as amended, and applicable state securities laws, the common shares issued to such shareholders pursuant to the Marathon Merger or upon exercise of warrants (the “Marathon Registration Rights Agreement”).
On October 29, 2018, we entered into an Amended and Restated Registration Rights Agreement (the “Amended and Restated Registration Rights Agreement”), which amended and restated the Marathon Registration Rights Agreement, with KEP VI, KIA VIII, CMA CGM, Management Investor Co., Anmani Consulting Inc., Marathon Founders, LLC, Michael S. Gross and Maas Capital Investments B.V. with respect to all Class A common shares and Series C Preferred Shares held by such shareholders on the closing date of the Poseidon Transaction, including any Class A common shares issuable on conversion of Series C Preferred Shares. The Amended and Restated Registration Rights Agreement became effective on the closing of the Poseidon Transaction. Pursuant to the Amended and Restated Registration Rights Agreement, we with the SEC a shelf registration statement to register the offer and resale of all securities covered by the Amended and Restated Registration Rights Agreement, which registration statement became effective on May 28, 2019. The Amended and Restated Registration Rights Agreement provides certain piggyback and demand registration rights. The Amended and Restated Registration Rights Agreement also provides that the shareholders party to it will not transfer any shares covered by the agreement for a period of six months following the closing of the Poseidon Transaction (with certain exceptions) and contains customary indemnification and other provisions.
Letter Agreement
On October 29, 2018, we entered into a Letter Agreement with affiliates of Kelso, CMA CGM, Marathon Founders, LLC and Michael S. Gross. The Letter Agreement became effective on the closing of the Poseidon Transaction.
Pursuant to the Letter Agreement, (a) for so long as CMA CGM holds at least 5% of our voting power, CMA CGM has the right to designate (and Kelso has the obligation to vote in favor of) an individual nominee to serve on our Board of Directors (and such nominee will also have a right to serve on the Audit Committee of the Board of Directors), (b) for so long as CMA CGM holds at least 10% of our voting power, CMA CGM has the right to designate (and Kelso has the obligation to vote in favor of) two individuals to serve on the Board of Directors and (c) CMA CGM designated Philippe Lemonnier and Alain Wils as the two individuals to serve on the Board of Directors.
The Letter Agreement also contains certain participation and tag-along rights. For example, each of Kelso and CMA CGM has the right to purchase a pro rata portion of any new issuance of securities by us (other than certain exempt issuances) for so long as it holds at least 10% of our voting power. Additionally, each of CMA CGM, Marathon Founders, LLC and Mr. Gross have the right to transfer Class A common shares pro rata alongside Kelso in any transfer or series of related transfers by Kelso to a third party that would result in the third party acquiring more than 30% of our voting power (with the exception of certain exempt transfers).
The Letter Agreement also provides that, for so long as CMA CGM holds at least 5% of our voting power, we may not make any material change in the nature of our business without the unanimous consent of the Board of Directors.
79
Table of Contents
Non-Compete Agreement
On October 29, 2018, we entered into a Non-Compete Agreement with Mr. George Giouroukos and Conchart reflecting, among others, the provisions described below. The Non-Compete Agreement became effective on the closing of the Poseidon Transaction.
Restricted Business
For so long as Mr. Giouroukos is our Executive Chairman, Mr. Giouroukos and any entity which he controls agreed not to acquire, own or operate containerships. However, under certain exceptions, Mr. Giouroukos, and any entity which he controls, may compete with us, which could affect our business. Specifically, Mr. Giouroukos, and any entity which he controls, will not be prevented from:
| (1) | acquiring, owning, operating or chartering ships other than containerships; |
| (2) | acquiring or owning one or more containerships if we decide not to exercise our right of first refusal to acquire such containership, in accordance with the terms of the Non-Compete Agreement described below under “Right of First Refusal”; |
| (3) | acquiring, owning, operating or chartering one or more containerships as part of the acquisition of a controlling interest in a business or package of assets that owns, operates or charters such containerships; provided, however, that Mr. Giouroukos, and any entity which he controls must offer to sell such containership(s) to us at their fair market value plus any additional tax or other similar costs that Mr. Giouroukos, and any entity which he controls, incurs in connection with the acquisition and the transfer of such containership to us separate from the acquired business, if a majority of the value of the business or the package of assets acquired is attributable to containerships; |
| (4) | providing ship management services relating to containerships, or other ship types, including technical and commercial management, warehouse transactions for financial institutions and pool management; |
| (5) | acquiring, owning, operating or chartering any containership that Mr. Giouroukos, and any entity which he controls, owned or operated or had a contractual arrangement with respect to as of the closing date of the Plan of Merger by and among Poseidon Containers Holdings LLC, K&T Marine LLC, us and other parties; |
| (6) | transferring to Mr. Giouroukos or any entity which he controls, title to a ship that Mr. Giouroukos or such entity that he controls or any third party is entitled to acquire, own and operate under the Non-Compete Agreement, pursuant to or in connection with the termination of a financing arrangement, including by way of a sale and leaseback or similar transaction, which is accounted for under United States generally accepted accounting principles as a financial lease; and |
| (7) | acquiring, owning, operating or chartering any containership that is subject to an offer to purchase as described in paragraphs (2) and (3) above, in each case pending the offer of such containership to us and our determination whether to purchase the containership and, if so, pending the closing of such purchase. |
Further to the above, notwithstanding this agreement, Mr. Giouroukos, and any entity which he controls, may claim business opportunities that would benefit us, and this could have an adverse effect on our business, results of operations, cash flows, financial condition and ability to pay dividends.
Right of First Refusal
Mr. Giouroukos, and any entity he controls, agreed to grant us a right of first refusal to acquire any containership, after Mr. Giouroukos, or an entity controlled by him, enters into an agreement that sets forth terms upon which he or it would acquire such containership. Mr. Giouroukos, or such entity controlled by him, shall notify us within 30 days of any agreement that he, or his controlled entity, has entered into to purchase a
80
Table of Contents
containership and will provide a period of 7 calendar days in respect of a single ship transaction, or a period of 14 calendar days in respect of a multi-ship transaction, from the date that he delivers such notice to us of said opportunity, within which to decide whether or not to accept the opportunity and nominate a subsidiary of ours to become the purchaser of such containership, before Mr. Giouroukos, or any entity he controls, will accept the opportunity or offer it to any of his other affiliates or entities controlled by him. The opportunity offered to us will be on no less favorable terms than those offered to Mr. Giouroukos, or entity controlled by him. The approval of our conflicts committee which is comprised of independent directors will be required to accept or reject this offer.
Upon a change of control of us, these rights of first refusal will terminate immediately. In addition, at such time that Mr. Giouroukos ceases to serve as our Executive Chairman, these rights of first refusal as applicable to Mr. Giouroukos will terminate immediately.
Right of First Offer on Containerships
Mr. Giouroukos agreed to grant a right of first offer to us for any containership he, or any entity controlled by him, owns or acquires, upon any proposed sale, transfer, or other disposition.
Prior to entering into any transaction regarding any containership’s disposition with a non-affiliated third party, Mr. Giouroukos, or such entity controlled by him, will deliver a written notice to us setting forth the material terms and conditions of the proposed transaction. During the 14-day period after the delivery of such notice, and at our election we (through our conflicts committee) and Mr. Giouroukos, or such entity controlled by him, will negotiate in good faith to reach an agreement on the transaction, which shall be approved by our conflicts committee which is comprised of independent directors. If we do not reach an agreement within such 14-day period, Mr. Giouroukos, or such entity controlled by him, as the case may be, will be able within the next 180 calendar days to sell, transfer, dispose or re-contract the containership to a third party (or to agree in writing to undertake such transaction with a third party) on terms generally no less favorable than those offered pursuant to the written notice.
Upon a change of control of us, these rights of first offer will terminate immediately. In addition, at such time that Mr. Giouroukos ceases to serve as our Executive Chairman, these rights of first offer as applicable to Mr. Giouroukos will terminate immediately.
Chartering Opportunities
If Conchart, or any entity it controls, acquires knowledge of a potential opportunity to enter into a potential charter with or without profit sharing for a particular containership that it believes in good faith would be suitable for our ships, which we refer to as a “Potential Charter Opportunity,” then Conchart, or such entity that it controls, would be obliged to offer such Potential Charter Opportunity to us and, for a period of up to two business days, we shall have the right to elect to pursue such Potential Charter Opportunity for ourselves or allow Conchart to direct such Potential Charter Opportunity to itself or another person or entity. In determining suitability of a Potential Charter Opportunity, Conchart shall take into consideration certain factors, such as the availability, suitability and positioning of the relevant ship, the potential charterer’s demands for the ship’s specifications and costs. In the event we do not elect to accept the Potential Charter Opportunity, Conchart shall be free to pursue such Potential Charter Opportunity or direct it to another person or entity for a period of 15 calendar days on the same terms and conditions as presented to us.
Technical and Commercial Management Agreements
Our Executive Chairman, Mr. George Giouroukos, is a significant shareholder of Technomar, which provides day-to-day technical ship management services to us on all of our ships pursuant to technical ship management agreements. Mr. Giouroukos is also a significant shareholder of Conchart, which provides
81
Table of Contents
commercial management services for 23 of our ships and is exclusive broker for 18 of our ships. For more information regarding our management agreements with Technomar and Conchart, please see “Item 7. Major Shareholders and Related Party Transactions—B. Related Party Transactions—Ship Management Agreements” contained in our Annual Report on Form 20-F for the year ended December 31, 2018, filed with the Commission on March 29, 2018 and incorporated herein by reference.
Kelso Letter Agreement
In September 2019, we entered into an agreement with Kelso, whereby Kelso agreed to convert its outstanding Series C Preferred Shares into Class A common shares upon the repayment in full of our 9.875% First Priority Secured Notes due 2022.
82
Table of Contents
SECURITY OWNERSHIP OF CERTAIN BENEFICIAL OWNERS AND MANAGEMENT
The following table sets forth information regarding beneficial ownership of our common shares for (i) owners of more than five percent of our common shares and (ii) our directors and officers, of which we are aware as of the date of this prospectus.
Except as otherwise indicated, each person or entity named in the table below has sole voting and investment power with respect to all of our Class A common shares or our Series C Preferred Shares, shown as beneficially owned, subject to applicable community property laws. As of the date of this prospectus, an aggregate of 9,942,950 Class A common shares were issued and outstanding, and no Class B common shares are issued and outstanding, all Class B common shares having converted to Class A common shares on January 2, 2019. In addition, there were an aggregate of 250,000 Series C Preferred Shares outstanding, all held by Kelso affiliates, which convert in limited circumstances to an aggregate of 12,955,187 Class A common shares. Upon the occurrence of any liquidation, dissolution or winding up of our affairs, holders of Series C Perpetual Shares shall be entitled to receive an amount equal to the amount payable in respect of the number of Class A common shares into which such Series C Preferred Shares would be convertible at such time, such amount to be determined as of the record date for determination of holders of Class A common shares entitled to receive such distribution or, if no such record date is established, as of the date of such distribution. Holders of Series C Preferred Shares are entitled to a dividend only should such a dividend be declared on our Class A common shares.
In September 2019, we entered into an agreement with Kelso, whereby Kelso agreed to convert its outstanding Series C Preferred Shares into Class A common shares upon the repayment in full of our 9.875% First Priority Secured Notes due 2022.
The Class A common shares each have one vote and vote together as a single class except that any amendment to the articles of incorporation, including those made pursuant to the terms of any merger, consolidation or similar transaction, that would increase or decrease the aggregate number of authorized common shares of a class, increase or decrease the par value of common shares of a class, or alter or change the powers, preferences or rights of the class of common shares so as to affect them adversely, must be approved by the holders of not less than a majority of the votes entitled to be cast by the holders of such class of common shares then outstanding, voting separately as a class. Each Series C Preferred Share is entitled to 38.75 votes on all matters submitted to a vote of the shareholders. The holders of Series C Preferred Shares vote together with the common shareholders as one class on all matters submitted to a vote of the shareholders.
| Name of Beneficial Owner |
Amount of Beneficial Ownership of Class A Common Shares |
Approximate Percentage of Outstanding Common Shares(1) |
||||||
| George Giouroukos |
1,969,188 | (2) | 19.80 | % | ||||
| Michael S. Gross |
1,344,094 | (3) | 13.52 | % | ||||
| Alain Wils |
1,312 | 0.01 | % | |||||
| Philippe Lemonnier |
0 | 0 | % | |||||
| Henry Mannix III |
155,750 | (4) | 1.57 | % | ||||
| Michael Chalkias |
0 | 0 | % | |||||
| Ian J. Webber |
55,312 | 0.56 | % | |||||
| Thomas Lister |
26,904 | 0.27 | % | |||||
| Anastasios Psaropoulos |
0 | 0 | % | |||||
| All directors and executive officers as a group (11 individuals) |
3,552,560 | 35.73 | % | |||||
| CMA CGM S.A. |
3,051,587 | (5) | 30.69 | % | ||||
| MAAS Capital |
1,036,415 | 10.42 | % | |||||
| KIA VIII (Newco Marine) Ltd. |
155,750 | (4) | 1.57 | % | ||||
| KEP VI (Newco Marine) Ltd. |
155,750 | (4) | 1.57 | % | ||||
83
Table of Contents
| (1) | Calculated based on 9,942,950 common shares outstanding as of the date of this prospectus. |
| (2) | Mr. Giouroukos, who serves as our Executive Chairman, owns and controls Management Investor Co., which is the record holder of 1,969,188 Class A common shares. As a result, Mr. Giouroukos may be deemed to beneficially own the shares held by Management Investor Co. |
| (3) | This information is derived from a Schedule 13D/A filed with the SEC on January 3, 2019. Michael S. Gross directly holds 566,880 shares of Class A Common Stock. Marathon Founders, LLC directly holds 777,214 shares of Class A Common Stock. As the Managing Member of Marathon Founders, LLC, Mr. Gross may be deemed to exercise voting rights and investment power over all securities of Global Ship Lease, Inc. held by Marathon Founders, LLC and thus may be deemed to beneficially own such shares. |
| (4) | This information is derived from a Schedule 13D filed with the SEC on November 26, 2018. Includes Class A common shares deemed to be beneficially owned by KIA VIII (Newco Marine) Ltd., or KIA VIII, and KEP VI (Newco Marine) Ltd., or KEP VI, by virtue of a voting agreement entered into among KEP VIII, KEP VI, CMA CGM S.A. and Michael S. Gross. KEP VI (Cayman, L.P., KEP VI (Cayman) GP Ltd., KIA VIII (International), L.P., KELSO GP VIII (Cayman) L.P., KELSO GP VIII (Cayman) Ltd., Frank T. Nickell, Thomas R. Wall, IV, George E. Matelich, Michael B. Goldberg, David I. Wahrhaftig, Frank K. Bynum, Jr., Philip Berney, Frank J. Loverro, James J. Connors, II, Stanley de J. Osborne, Church M. Moore, Christopher L. Collins, Anna Lynn Alexander, Howard A. Matlin, Stephen C. Dutton, Matthew S. Edgerton, John K. Kim and Henry Mannix III (the “Kelso Joint Filers”) may be deemed to share beneficial ownership of these Class A common shares. Each of the Kelso Joint Filers share investment and voting power with respect to any Class A common shares beneficially owned by KIA VIII and KEP VI but disclaim beneficial ownership of such Class A common shares. |
In addition, there were an aggregate of 250,000 Series C Preferred Shares outstanding, all held by Kelso affiliates, which convert in limited circumstances to an aggregate of 12,955,187 Class A common shares. Each Series C Preferred Share is entitled to 38.75 votes on all matters submitted to a vote of the shareholders. The holders of Series C Preferred Shares vote together with the common shareholders as one class on all matters submitted to a vote of the shareholders. According to information contained in public filings, KEP VI (Newco Marine) Ltd. and KIA VIII (Newco Marine) Ltd., both affiliates of Kelso & Company, a U.S. private equity firm, hereafter referred to as Kelso, controls approximately 50.1% of the vote on any matter submitted to the vote of our common shareholders, through its ownership of Series C Preferred Shares and by virtue of the voting agreement with certain other of our shareholders.
| (5) | This information is derived from a Schedule 13D/A filed with the SEC on January 14, 2019. CMA CGM S.A. is controlled by Merit Corporation S.A.L., which may be deemed to exercise voting and investment power over all securities of Global Ship Lease, Inc. held by CMA CGM S.A. and thus may be deemed to beneficially own such securities. |
As of August 31, 2019, we had 20 registered shareholders of record, eight of which were located in the United States and held an aggregate of 3,944,833 of our Class A common shares, representing 39.7% of our outstanding common shares. However, one of the U.S. shareholders of record is CEDE & CO., a nominee of The Depository Trust Company, which held 3,146,005 of our Class A common shares as of August 31, 2019. We believe that the shares held by CEDE & CO. include common shares beneficially owned by both holders in the United States and non-U.S. beneficial owners.
Other than Kelso by virtue of its beneficial ownership of Series C Preferred Shares, our major shareholders, directors and executive officers do not have different voting rights.
We are not aware of any arrangements the operation of which may at a subsequent date result in our change of control.
84
Table of Contents
Authorized Capitalization
Under our Articles of Incorporation, as amended, our authorized share capital consists of:
| • | 214,000,000 Class A common shares, $0.01 per share, of which 9,942,950 shares were issued and outstanding as of the date of this prospectus; |
| • | 20,000,000 Class B common shares, par value $0.01 per share, of which none were issued and outstanding as of the date of this prospectus; |
| • | 15,000,000 Class C common shares, par value $0.01 per share, of which none were issued and outstanding as of the date of this prospectus; |
| • | 16,100 Series B Preferred Shares, par value $0.01 per share, of which 14,000 shares were issued and outstanding as of the date of this prospectus; and |
| • | 250,000 Series C Preferred Shares, par value $0.01 per share, of which 250,000 shares were issued and outstanding as of the date of this prospectus. |
Share History
In each of 2016 and 2017, 4,266 Class A common shares were awarded to our directors under our 2015 Equity Incentive Plan, representing 20% of their base compensation.
On November 15, 2018, we completed the Poseidon Transaction. The consideration for the acquisition of the net assets was 3,005,603 Class A common shares and 250,000 Series C Preferred Shares. In addition, as a consequence of the completion of the Poseidon Transaction, all outstanding stock awards to officers and employees vested and 60,425 Class A common shares were issued in November 2018.
On January 2, 2019, as a consequence of the completion of the Poseidon Transaction, all of our issued and outstanding Class B common shares converted one-for-one into 925,745 Class A common shares.
On March 25, 2019, we effected a one-for-eight reverse stock split of our Class A common shares, which our shareholders authorized at our special meeting of shareholders held on March 20, 2019. There was no change to the trading symbol, number of authorized shares, or par value of our Class A common shares in connection with the reverse stock split. All share and per share amounts disclosed in this prospectus give effect to the reverse stock split retroactively.
Memorandum and Articles of Association
The rights, preferences and restrictions attaching to each class of shares of our capital stock are described in the sections “Description of Capital Shares,” “Description of Preferred Shares,” and “Description of Depositary Shares” of the Amendment No. 1 to our registration statement on Form F-3 (File No. 333-197518) filed with the Commission on July 28, 2014 and hereby incorporated by reference into this prospectus. There have been no changes since that date, other than the issuance of the Series B Preferred Shares in August 2014 and Series C Preferred Shares in November 2018, as described below.
On August 20, 2014, we issued 1,400,000 depositary shares, each of which represents 1/100th of one share of our Series B Preferred Shares. In the event of any liquidation, dissolution or winding up of our affairs, holders of the Series B Preferred Shares will have the right to receive the liquidation preference of $2,500.00 per share of Series B Preferred Shares (equivalent to $25.00 per depositary share or $35.0 million in the aggregate) plus an amount equal to all accumulated and unpaid dividends thereon to the date of payment, whether or not declared. Dividends are payable at 8.75% per annum in arrears on a quarterly basis, when and if declared by the Board of
85
Table of Contents
Directors. Following the issuance of the Series B Preferred Shares of the Company, no dividend may be declared or paid or set apart for payment on our common stock and each other class or series of capital stock established after the original issue date of the Series B Preferred Shares that is not expressly made senior to or on parity with the Series B Preferred Shares as to the payment of dividends and amounts payable upon liquidation, dissolution or winding up, whether voluntary or involuntary (“Junior Securities”) (other than a dividend payable solely in Junior Securities), unless full cumulative dividends have been or contemporaneously are being paid or declared and set aside for payment on all outstanding Series B Preferred Shares and any securities that rank pari passu with the Series B Preferred Shares through the most recent respective dividend payment dates. Holders of the Series B Preferred Shares generally have no voting rights, except in limited circumstances. At any time after August 20, 2019 (or within 180 days after the occurrence of a fundamental change), the Series B Preferred Shares may be redeemed, at the discretion of the Company, in whole or in part, at a redemption price of $2,500.00 per share (equivalent to $25.00 per depositary share). The rights, preferences and restrictions attaching to the Series B Preferred Shares are described in the section “Description of Series B Preferred Shares and Depositary Shares” of our prospectus supplement dated August 13, 2014 filed with the Commission on August 15, 2014 and hereby incorporated by reference into this prospectus. There have been no changes since that date. The rights, preferences and restrictions attaching to the Series B Preferred Shares are further qualified by (i) the Certificate of Designations of Global Ship Lease, Inc., filed with the Registrar or Deputy Registrar of Corporations of the Republic of the Marshall Islands and effective August 19, 2014, and (ii) the Deposit Agreement, dated as of August 20, 2014, by and among Global Ship Lease, Inc., Computershare Inc. and Computershare Trust Company, N.A., as applicable, as depositary, registrar and transfer agent, and the holders from time to time of the depositary receipts described therein (each of (i) and (ii) being incorporated by reference to Exhibits 3.1 and 4.1, respectively, of Global Ship Lease, Inc.’s Report on Form 6-K (File No. 001-34153) filed on August 20, 2014), each of which is hereby incorporated by reference into this prospectus. There have been no changes since that date.
On November 15, 2018, we issued 250,000 Series C Preferred Shares of par value $0.01 per share. The Series C Preferred Shares are convertible to an aggregate of 12,955,187 Class A common shares at the option of the holder on the date when our 9.875% First Priority Secured Notes due 2022 are no longer outstanding. In addition, the Series C Preferred Shares will convert automatically upon transfer to any person who is not an affiliate of the initial holder of such Series C Preferred Shares. In September 2019, we entered into an agreement with Kelso, whereby Kelso agreed to convert its outstanding Series C Preferred Shares into Class A common shares upon the repayment in full of our 9.875% First Priority Secured Notes due 2022. Upon the occurrence of any liquidation, dissolution or winding up of our affairs, holders of Series C Perpetual Shares shall be entitled to receive an amount equal to the amount payable in respect of the number of Class A common shares into which such Series C Preferred Shares would be convertible at such time, such amount to be determined as of the record date for determination of holders of Class A common shares entitled to receive such distribution or, if no such record date is established, as of the date of such distribution. Holders of Series C Preferred Shares are entitled to a dividend only should such a dividend be declared on our Class A common shares. If our Board of Directors declares a dividend or other distribution upon the then-outstanding Class A common shares, then the holders of the Series C Preferred Shares shall be entitled to receive the amount of dividends as would be payable in respect of the number of Class A common shares into which such Series C Preferred Shares would be convertible. Each Series C Preferred Share shall entitle the holder thereof to 38.75 votes on all matters submitted to a vote of shareholders. Except as otherwise provided in the Certificate of Designation for Series C Preferred Shares or required by law, the Series C Preferred Shares shall vote together with the Common Shares as one class in the election of directors of the Company and on all other matters submitted to a vote of the shareholders. The Series C Preferred Shares shall be perpetual and shall not be subject to mandatory redemption, sinking fund or other similar provisions. The rights, preferences and restrictions attaching to the Series C Preferred Shares are described in the Certificate of Designation for Series C Perpetual Preferred Shares of Global Ship Lease, Inc. (incorporated by reference to Exhibit A of Global Ship Lease, Inc.’s Report on Form 6-K (File No. 001-34153) filed on October 29, 2018) and hereby incorporated by reference into this prospectus. There have been no changes since that date.
86
Table of Contents
In September 2019, we entered into an agreement with Kelso, whereby Kelso agreed to convert its outstanding Series C Preferred Shares into Class A common shares upon the repayment in full of our 9.875% First Priority Secured Notes due 2022.
We are not aware of any limitations on the rights to own securities, including the rights of non-resident or foreign shareholders to hold or exercise voting rights on the securities, imposed by the laws of the Republic of the Marshall Islands or by our Articles of Incorporation or Bylaws.
Listing
Our Class A common shares have been listed on the NYSE under the symbol “GSL” since August 15, 2008. Our depositary shares, each of which represents a 1/100th interest in a share of our Series B Preferred Shares, began trading on the NYSE under the symbol “GSL-B” on August 14, 2014.
Registration Rights Agreements
In connection with this offering, we have agreed to enter into a registration rights agreement with B. Riley FBR, Inc. (“B. Riley FBR”), one of the underwriters in this offering, or its affiliates, pursuant to which we will agree to register any shares of our Class A common stock held by B.Riley FBR or its affiliates following the completion of this offering to the extent such shares constitute “restricted” or “control” securities under applicable rules and regulations of the SEC (the “B. Riley Registration Rights Agreement”). We expect that the B. Riley Registration Rights Agreement will provide B. Riley FBR or its affiliates with certain piggyback and demand registration rights, and contain customary indemnification and other provisions.
We also have a registration rights agreement with certain of our major shareholders that was entered into at the time of the Marathon Merger, and that was subsequently amended and restated in October 2018. For a description of the Amended and Restated Registration Rights Agreement, see the section of this prospectus entitled “Certain Relationships and Related Party Transactions.”
87
Table of Contents
The following represents the opinion of our United States and Marshall Islands tax counsel, Seward & Kissel LLP, and is a summary of the material U.S. federal income tax and Marshall Islands tax consequences of the ownership and disposition of our Class A common shares.
This section is based on current provisions of the Code, current and proposed Treasury regulations promulgated thereunder, and administrative and judicial decisions as of the date hereof, all of which are subject to change or differing interpretation, possibly on a retroactive basis. Changes in these authorities may cause the tax consequences of Class A common share ownership to vary substantially from the consequences described below.
This section does not purport to be a comprehensive description of all of the tax considerations that may be relevant to us or each investor. This section does not address all aspects of U.S. federal income taxation that may be relevant to any particular investor based on such investor’s individual circumstances. In particular, this section considers only investors that will own Class A common shares as capital assets and does not address the potential application of the alternative minimum tax or the U.S. federal income tax consequences to investors that are subject to special treatment, including:
| • | broker-dealers; |
| • | insurance companies; |
| • | taxpayers who have elected mark-to-market accounting; |
| • | tax-exempt organizations; |
| • | regulated investment companies; |
| • | real estate investment trusts; |
| • | financial institutions or “financial services entities”; |
| • | taxpayers who hold Class A common shares as part of a straddle, hedge, conversion transaction or other integrated transaction; |
| • | taxpayers required to recognize income for U.S. federal income tax purposes no later than when such income is reported on an “applicable financial statement”; |
| • | taxpayers that own 10% or more, directly or constructively, of the Class A common shares; |
| • | certain expatriates or former long-term residents of the United States; and |
| • | U.S. holders (as defined herein) whose functional currency is not the U.S. dollar. |
No ruling has been or will be requested from the IRS regarding any matter affecting us or our shareholders. The statements made herein may be challenged by the IRS and, if so challenged, may not be sustained upon review in a court.
The following does not address any aspect of U.S. federal gift or estate tax laws, or state or local tax laws. Additionally, the section does not consider the tax treatment of partnerships or other pass-through entities or persons who hold our Class A common shares through such entities. Shareholders should consult their tax advisors regarding the specific tax consequences to them of the acquisition, holding or disposition of our Class A common shares, in light of their particular circumstances.
88
Table of Contents
Taxation of Global Ship Lease
Taxation of operating income
Unless exempt from U.S. federal income taxation under the rules described below in “The Section 883 exemption,” a foreign corporation that earns only transportation income is generally subject to U.S. federal income taxation under one of two alternative tax regimes: (1) the 4% gross basis tax or (2) the net basis tax and branch profits tax.
The 4% gross basis tax
For foreign corporations not engaged in a U.S. trade or business, the United States imposes a 4% U.S. federal income tax (without allowance of any deductions) on the corporation’s U.S. source gross transportation income. For this purpose, transportation income includes income from the use, hiring or leasing of a ship, or the performance of services directly related to the use of a ship (and thus includes time charter and bareboat charter income). The U.S. source portion of transportation income includes 50% of the income attributable to voyages that begin or end (but not both) in the United States. Generally, no amount of the income from voyages that begin and end outside the United States is treated as U.S. source, and consequently none of the transportation income attributable to such voyages is subject to this 4% tax. Although the entire amount of transportation income from voyages that begin and end in the United States would be U.S. source, we do not expect to have any transportation income from voyages that begin and end in the United States.
The net basis tax and branch profits tax
We do not expect to engage in any activities in the United States or otherwise have a fixed place of business in the United States. Nonetheless, if this situation were to change or were we to be treated as engaged in a U.S. trade or business, all or a portion of our taxable income, including gains from the sale of ships, could be treated as effectively connected with the conduct of this U.S. trade or business, or effectively connected income. Any effectively connected income would be subject to U.S. federal corporate income tax, currently imposed at a rate of 21%. In addition, an additional 30% branch profits tax would be imposed on us at such time as our after-tax effectively connected income is viewed as having been repatriated to our offshore office. The 4% gross basis tax described above is inapplicable to income that is treated as effectively connected income.
The Section 883 exemption
The 4% gross basis tax described above is inapplicable to U.S. source transportation income that qualifies for exemption under Section 883 of the Code. To qualify for the Section 883 exemption, a foreign corporation must, among other things:
| • | be organized in a jurisdiction outside the United States that grants an equivalent exemption from tax to corporations organized in the United States, which we call an Equivalent Exemption; |
| • | satisfy one of the following three ownership tests (discussed in more detail below): (1) the more than 50% ownership test, or 50% Ownership Test, (2) the controlled foreign corporation test, or CFC Test or (3) the “Publicly Traded Test”; and |
| • | meet certain substantiation, reporting and other requirements (that include the filing of U.S. income tax returns). |
We are organized under the laws of the Marshall Islands. Each of the ships in the fleet is owned by a separate wholly owned subsidiary organized either in the Marshall Islands, Cyprus or Hong Kong. The U.S. Treasury Department recognizes the Marshall Islands, Cyprus and Hong Kong as jurisdictions that grant an Equivalent Exemption; therefore, we should meet the first requirement for the Section 883 exemption. Additionally, we intend to comply with the substantiation, reporting and other requirements that are applicable under Section 883 of the Code. As a result, qualification for the Section 883 exemption will turn primarily on our ability to satisfy the second requirement enumerated above.
89
Table of Contents
(1) The 50% Ownership Test
In order to satisfy the 50% Ownership Test, a non-U.S. corporation must be able to substantiate that more than 50% of the value of its stock is owned, directly or indirectly, by “qualified shareholders.” For this purpose, qualified shareholders include: (1) individuals who are residents (as defined in the regulations promulgated under Section 883 of the Code, or Section 883 Regulations) of countries, other than the United States, that grant an Equivalent Exemption, (2) non-U.S. corporations that meet the Publicly Traded Test of the Section 883 Regulations and are organized in countries that grant an Equivalent Exemption, or (3) certain foreign governments, non-profit organizations, and certain beneficiaries of foreign pension funds. A corporation claiming the Section 883 exemption based on the 50% Ownership Test must obtain all the facts necessary to satisfy the IRS that the 50% Ownership Test has been satisfied (as detailed in the Section 883 Regulations). We believe that we satisfied the 50% Ownership Test, up to and including 2008, due to being a wholly owned subsidiary of CMA CGM until the Marathon Merger on August 14, 2008, but believe that we currently may not be able to satisfy the 50% Ownership Test.
(2) The CFC Test
The CFC Test requires that the non-U.S. corporation be treated as a controlled foreign corporation, or CFC, for U.S. federal income tax purposes. We believe that we are not a CFC but cannot predict whether we will become a CFC, and satisfaction of the CFC definitional test is outside of our control.
(3) The Publicly Traded Test
The Publicly Traded Test requires that one or more classes of equity representing more than 50% of the voting power and value in a non-U.S. corporation be “primarily and regularly traded” on an established securities market either in the United States or in a foreign country that grants an Equivalent Exemption.
The Section 883 Regulations provide, in pertinent part, that stock of a non-U.S. corporation will be considered to be “primarily traded” on an established securities market in a given country if the number of shares of each class of stock that are traded during any taxable year on all established securities markets in that country exceeds the number of shares in each such class that are traded during that year on established securities markets in any other single country. Our Class A common shares are listed on the NYSE and are not listed on any other securities exchange. Therefore, our Class A common shares should be treated as primarily traded on an established securities market in the United States. Moreover, the Class A common shares currently represent more than 50% of both the voting power and value of all classes of our shares. However, it is possible that the value of the class of Series B preferred shares may be greater than the value of the class of our Class A common shares. No assurance can be given that the Class A common shares will continue to represent more than 50% of both the voting power and value of all classes of our shares.
The Section 883 Regulations also generally provide that stock will be considered to be “regularly traded” on an established securities market if one or more classes of stock in the corporation representing in the aggregate more than 50% of the total combined voting power and value of all classes of stock of the corporation are listed on an established securities market during the taxable year. However, even if a class of shares is so listed, it is not treated as regularly traded under the Section 883 Regulations unless (1) trades are made in the shares on the established securities market, other than in minimal quantities, on at least 60 days during the taxable year (or 1/6 of the days in a short taxable year); and (2) the aggregate number of shares traded on the established securities market during the taxable year is at least 10% of the average number of outstanding shares of that class during that year (as appropriately adjusted in the case of a short taxable year). Even if these trading frequency and trading volume tests are not satisfied with respect to the Class A common shares, however, the Section 883 Regulations provide that such tests will be deemed satisfied if the Class A common shares are regularly quoted by dealers making a market in such Class A common shares. While we anticipate that these trading frequency and trading volume tests will be satisfied each year, satisfaction of these requirements is outside of our control and, hence, no assurances can be provided that we will satisfy the Publicly Traded Test each year.
90
Table of Contents
In addition, even if the “primarily and regularly traded” tests described above are satisfied, a class of stock will not be treated as primarily and regularly traded on an established securities market if, during more than half the number of days during the taxable year, one or more shareholders holding, directly or indirectly, at least 5% of the vote and value of that class of stock, or 5% Shareholders, own, in the aggregate, 50% or more of the vote and value of that class of stock. This is referred to as the 5% Override Rule. In performing the analysis, we are entitled to rely on current Schedule 13D and 13G filings with the SEC to identify our 5% Shareholders, without having to make any independent investigation to determine the identity of the 5% Shareholder. In the event the 5% Override Rule is triggered, the Section 883 Regulations provide that the 5% Override Rule will nevertheless not apply if the company can establish that among the closely-held group of 5% Shareholders, sufficient shares are owned by 5% Shareholders that are considered to be “qualified shareholders,” as defined above, to preclude non-qualified 5% Shareholders in the closely-held group from owning 50% or more of the total value of the relevant class of stock held by 5% Shareholders for more than half the number of days during the taxable year.
Based on information that we have as to our shareholders and other matters, we believed that we qualified for the Section 883 exemption for 2009 through 2018 under the Publicly Traded Test. However, as a result of the Poseidon Transaction, our ownership has changed such that nonqualified shareholders may own, in the aggregate, 50% or more of the total value of our Class A common stock, causing the 5% Override Rule to apply. If the 5% Override Rule applies, we would fail the Publicly Traded Test, and would fail to qualify for the Section 883 exemption. Therefore, we do not expect to qualify for the Section 883 exemption for 2019. It is uncertain whether we will qualify, and continue to qualify, for the Section 883 exemption in future taxable years.
Such an ownership change, and certain other requirements for our stock to be treated as primarily and regularly traded on an established securities market, are outside of our control and, as a result, no assurances can be provided that our stock will be so treated for any year. Moreover, since the availability of the Section 883 exemption depends on other matters over which we have no control, we can give no assurances that we will, or will continue to, qualify for the Section 883 exemption.
If we were not to qualify for the Section 883 exemption in any year, U.S. income taxes may become payable, based on our U.S. source gross transportation income. Whilst this U.S. income tax should be recoverable from our charterers under the charter contracts, there could be a negative effect on our business, and there could be a decrease in earnings available for distribution to our shareholders.
United States taxation of gain on sale of ships
If we qualify for the Section 883 exemption, then gain from the sale of any ship may be exempt from tax under Section 883. Even if such gain is not exempt from tax under Section 883, we will not be subject to U.S. federal income taxation with respect to such gain, assuming that we are not, and have never been, engaged in a U.S. trade or business. Under certain circumstances, if we are so engaged, gain on sale of ships could be subject to U.S. federal income tax.
Possibility of taxation as a U.S. corporation
Section 7874 of the Code provides that a foreign corporation that acquires substantially all the properties of a U.S. corporation is generally treated as though it were a U.S. corporation for U.S. federal income tax purposes if, after the acquisition, (1) at least 80% (by vote or value) of the stock of the foreign corporation is owned by former shareholders of the U.S. corporation by reason of owning stock in the U.S. corporation, and (2) the foreign corporation’s expanded affiliate group does not have substantial business activities in the foreign corporation’s jurisdiction of organization. Although we believe that this rule should not apply to us in the context of the Marathon Merger, there is no definitive legal authority applying the principles of Section 7874 of the Code and, therefore, there can be no assurance that the IRS would not seek to challenge such a position, or that such a challenge would not be successful.
91
Table of Contents
If we were to be treated as a U.S. corporation, our net income would be subject to U.S. federal corporate income tax, currently imposed at a rate of 21%. The imposition of this tax would likely have a negative effect on our business, financial condition and results of operations.
Tax Consequences of Holding Class A common shares
U.S. holders
For purposes of this discussion, a U.S. holder is a beneficial owner of our Class A common shares that owns (actually or constructively) less than 10% of our equity and that is:
| • | an individual who is a citizen or resident of the United States (as determined for U.S. federal income tax purposes); |
| • | a corporation (or other entity taxed as a corporation for U.S. federal income tax purposes) created or organized under the laws of the United States, any state thereof or the District of Columbia; |
| • | an estate whose income is includible in gross income for U.S. federal income tax purposes regardless of its source; or |
| • | a trust if (i) a court within the United States is able to exercise primary supervision over the administration of the trust and one or more U.S. persons have the authority to control all substantial decisions of the trust, or (ii) it has in effect a valid election to be treated as a U.S. person. |
Taxation of distributions paid on Class A common shares
When we make a distribution with respect to our Class A common shares, subject to the discussions of the passive foreign investment company, or PFIC rules below, a U.S. holder will be required to include in gross income as foreign source dividend income the amount of the distribution to the extent paid out of our current or accumulated earnings and profits as determined for U.S. federal income tax purposes. Distributions in excess of such earnings and profits will be applied against and will reduce the U.S. holder’s tax basis in the Class A common shares and, to the extent in excess of such basis, will be treated as gain from the sale or exchange of the Class A common shares.
Subject to the discussions of the PFIC rules below, in the case of a U.S. holder that is a corporation, dividends that we pay will generally be taxable at the regular corporate rate of 21% and generally will not qualify for a dividends-received deduction available for dividends received from U.S. corporations. In the case of certain non-corporate U.S. holders, dividends that we pay generally will be treated as “qualified dividend income” subject to tax at preferential rates, provided that the Class A common shares are listed on an established securities market in the United States (such as the NYSE), the U.S. holder meets certain holding period and other requirements and we are not a PFIC in the taxable year in which the dividends are paid or in the immediately preceding taxable year. Special rules may apply to any “extraordinary dividend” paid by us. An extraordinary dividend is, generally, a dividend with respect to a share if the amount of the dividend is equal to or in excess of 10 percent of a shareholder’s adjusted basis (or fair market value in certain circumstances) in such share. In addition, extraordinary dividends include dividends received within a one-year period that, in the aggregate, equal or exceed 20% of a U.S. holder’s tax basis (or fair market value).If we pay an “extraordinary dividend” on our Class A common shares that is treated as “qualified dividend income,” then any loss derived by certain non-corporate U.S. holders from the sale or exchange of such shares will be treated as long-term capital loss to the extent of the amount of such dividend.
Taxation of the disposition of Class A common shares
Subject to the discussions of the PFIC rules below, upon the sale, exchange or other disposition of Class A common shares, a U.S. holder will recognize capital gain or loss in an amount equal to the difference between the
92
Table of Contents
amount realized on the disposition and such U.S. holder’s tax basis in our Class A common shares. The U.S. holder’s initial tax basis in its Class A common shares generally will be the U.S. holder’s purchase price for the Class A common shares and that tax basis will be reduced (but not below zero) by the amount of any distributions on the units that are treated as non-taxable returns of capital, as discussed above under “Taxation of distributions paid on Class A common shares.”
Subject to the discussions of the PFIC rules below, capital gain from the sale, exchange or other disposition of Class A common shares held more than one year is long-term capital gain, and is eligible for a reduced rate of taxation for individuals. Gain recognized by a U.S. holder on a sale, exchange or other disposition of Class A common shares generally will be treated as U.S. source income. A loss recognized by a U.S. holder on the sale, exchange or other disposition of Class A common shares generally will be allocated to U.S. source income. The deductibility of a capital loss recognized on the sale, exchange or other disposition of Class A common shares may be subject to limitations, and U.S. holders may want to consult their own tax advisors regarding their ability to deduct any such capital loss in light of their particular circumstances.
3.8% tax on net investment income
A U.S. holder that is an individual, estate, or, in certain cases, a trust, will generally be subject to a 3.8% tax on the lesser of (1) the U.S. holder’s net investment income (or undistributed net investment income in the case of an estate or trust) for the taxable year and (2) the excess of the U.S. holder’s modified adjusted gross income for the taxable year over a certain threshold (which in the case of individuals is between $125,000 and $250,000). A U.S. holder’s net investment income will generally include distributions made by us that constitute dividends and gain upon a sale, exchange or other disposition of our Class A common shares. This tax is in addition to any income taxes due on such investment income.
If you are a U.S. holder that is an individual, estate or trust, you are encouraged to consult your tax advisors regarding the applicability of the 3.8% tax on net investment income to the ownership of our Class A common shares.
Consequences of possible passive foreign investment company classification
A non-U.S. entity treated as a corporation for U.S. federal income tax purposes will be a PFIC in any taxable year in which, after taking into account the income and assets of the corporation and certain subsidiaries pursuant to a “look through” rule, either: (1) 75% or more of its gross income is “passive” income or (2) 50% or more of the average value of its assets is attributable to assets that produce passive income or are held for the production of passive income. For purposes of these tests, “passive income” includes dividends, interest and gains from the sale or exchange of investment property and rents and royalties other than rents and royalties which are received from unrelated parties in connection with the active conduct of a trade or business; income derived from the performance of services does not, however, constitute “passive income.” The determination of whether a corporation is a PFIC is made annually. If a corporation is a PFIC in any taxable year that a person holds stock in the corporation (and was not a qualified electing fund with respect to such year, as discussed below), the stock held by such person will be treated as stock in a PFIC for all future years (absent an election which, if made, may require the electing person to pay taxes in the year of the election).
Based on the projected composition of our income and valuation of our assets, we do not expect that we will constitute a PFIC with respect to the current or any future taxable year, although there can be no assurance in this regard. Our expectation is based principally on the position that, for purposes of determining whether we are a PFIC, the majority, if not all, of the gross income we derive from our chartering activities should constitute services income rather than rental income.
In this regard, we have been advised by our tax advisor that the income from our chartering activities is, more likely than not, services income. There is, however, no direct legal authority under the PFIC rules
93
Table of Contents
addressing our current and projected future operations or supporting our position. Accordingly, no assurance can be given that the IRS will not assert that we are a PFIC with respect to any taxable year, nor that a court would not uphold any such assertion and we have not obtained advice from our tax advisor on whether we are a PFIC.
Further, in a case not concerning PFICs, Tidewater Inc. v. U.S., 2009-1 USTC ¶ 50,337, the Fifth Circuit held that a ship time charter at issue generated rental, rather than services, income. However, the court’s ruling was contrary to the position of the IRS that the time charter income should be treated as services income. Subsequently, the IRS has stated that it disagrees with and will not acquiesce to the rental versus services distinction in the Tidewater decision, and in its discussion stated that the time charters at issue in Tidewater would be treated as producing services income for PFIC purposes. The IRS’s statement with respect to Tidewater cannot be relied upon or otherwise cited as precedent by taxpayers. Further, the facts in Tidewater are not directly analogous to our facts. Consequently, no assurance can be given that the IRS or a court of law would accept our position, and there is a risk that the IRS or a court of law could determine that the company is a PFIC.
If we were to be classified as a PFIC in any year, each U.S. holder of our Class A common shares that does not make a timely qualified electing fund or mark-to-market election (as discussed below) will be subject (in that year and all subsequent years) to special rules with respect to: (1) any “excess distribution” (generally defined as any distribution received by a U.S. holder in a taxable year that is greater than 125% of the average annual distributions received by the U.S. holder in the three preceding taxable years or, if shorter, the U.S. holder’s holding period for the Class A common shares), and (2) any gain realized upon the sale or other disposition of the Class A common shares. Under these rules:
| • | the excess distribution or gain will be allocated ratably over the U.S. holder’s holding period for our Class A common shares; |
| • | the amount allocated to the current taxable year and any year prior to the first year in which we were a PFIC will be taxed as ordinary income in the current year; and |
| • | the amount allocated to each of the other taxable years in the U.S. holder’s holding period for our Class A common shares will be subject to U.S. federal income tax at the highest rate in effect for the applicable class of taxpayer for that year, and an interest charge will be added as though the amount of the taxes computed with respect to these other taxable years were overdue. |
In addition, each U.S. holder of our Class A common shares will generally be required to file an IRS Form 8621 if such U.S. holder holds its shares in any year in which we were classified as a PFIC.
In order to avoid the application of the PFIC rules discussed above with respect to excess distributions and realized gains, U.S. holders of our Class A common shares may make a qualified electing fund, or a QEF, election provided in Section 1295 of the Code. In lieu of the PFIC rules discussed above, a U.S. holder that makes a valid QEF election will, in very general terms, be required to include its pro rata share of our ordinary income and net capital gains, unreduced by any prior year losses, in income for each taxable year (as ordinary income and long-term capital gain, respectively) and to pay tax thereon, even if the amount of that income is not the same as the distributions paid on the Class A common shares during the year. If we later distribute the income or gain on which the U.S. holder has already paid taxes under the QEF rules, the amounts so distributed will not again be subject to tax in the hands of the U.S. holder. A U.S. holder’s tax basis in any Class A common shares as to which a QEF election has been validly made will be increased by the amount included in such U.S. holder’s income as a result of the QEF election and decreased by the amount of nontaxable distributions received by the U.S. holder. On the disposition of a common share, a U.S. holder making the QEF election generally will recognize capital gain or loss equal to the difference, if any, between the amount realized upon such disposition and its adjusted tax basis in the common share. In general, a QEF election should be made on or before the due date for filing a U.S. holder’s federal income tax return for the first taxable year for which we are a PFIC or, if later, the first taxable year for which the U.S. holder held common stock. In this regard, a QEF election is effective only if certain required information is made available by the PFIC. Subsequent to the date
94
Table of Contents
that we first determine that we are a PFIC, we will use commercially reasonable efforts to provide any U.S. holder of Class A common shares, upon request, with the information necessary for such U.S. holder to make the QEF election. If we do not believe that we are a PFIC for a particular year but it is ultimately determined that we were a PFIC, it may not be possible for a holder to make a QEF election for such year.
In addition to the QEF election, Section 1296 of the Code permits U.S. persons to make a “mark-to-market” election with respect to marketable stock in a PFIC. If a U.S. holder of our Class A common shares makes a mark-to-market election, such U.S. holder generally would, in each taxable year that we are a PFIC: (1) include as ordinary income the excess, if any, of the fair market value of the Class A common shares at the end of the taxable year over such U.S. holder’s adjusted tax basis in the Class A common shares, and (2) be permitted an ordinary loss in respect of the excess, if any, of such U.S. holder’s adjusted tax basis in the Class A common shares over their fair market value at the end of the taxable year, but only to the extent of the net amount previously included in income as a result of the mark-to-market election (with the U.S. holder’s basis in the Class A common shares being increased and decreased, respectively, by the amount of such ordinary income or ordinary loss). If a U.S. holder makes an effective mark-to-market election, any gain such U.S. holder recognizes upon the sale or other disposition of our Class A common shares in a year that we are a PFIC will be treated as ordinary income and any loss will be treated as ordinary loss, but only to the extent of the net amount previously included in income as a result of the mark-to-market election. The consequences of this election are generally less favorable than those of a QEF election for U.S. holders that are sensitive to the distinction between ordinary income and capital gain, although this is not necessarily the case. U.S. holders should consult their tax advisors as to the consequences to them of making a mark-to-market or QEF election, as well as other U.S. federal income tax consequences of holding stock in a PFIC in light of their particular circumstances.
As previously indicated, if we were to be classified as a PFIC for a taxable year in which we pay a dividend or the immediately preceding taxable year, dividends paid by us would not constitute “qualified dividend income” and, hence, would not be eligible for the preferential rates of U.S. federal income tax that apply to certain non-corporate U.S. holders.
If we are classified as a PFIC for any taxable year during which a U.S. holder holds our Class A common shares and any of our non-U.S. subsidiaries is also classified as a PFIC, such U.S. holder will be treated as owning a proportionate amount (by value) of the shares of the lower-tier PFIC for purposes of the application of the PFIC rules. U.S. holders are urged to consult their tax advisors about the application of the PFIC rules to any of our subsidiaries.
Non-U.S. holders
For purposes of this discussion, a non-U.S. holder is a beneficial owner of our Class A common shares that is neither a U.S. holder nor a partnership (or any other entity taxed as a partnership for U.S. federal income tax purposes).
A non-U.S. holder will generally not be subject to U.S. federal income tax on dividends paid in respect of the Class A common shares or on gains recognized in connection with the sale or other disposition of the Class A common shares, provided, in each case, that such dividends or gains are not effectively connected with the non-U.S. holder’s conduct of a U.S. trade or business. However, even if not engaged in a U.S. trader or business, individual non-U.S. holders may be subject to tax on gain resulting from the disposition of our Class A common shares if they are present in the U.S. for 183 days or more during the taxable year in which those Class A common shares are disposed and/or meet certain other requirements.
Dividends or gains that are effectively connected with a non-U.S. holder’s conduct of a U.S. trade or business (and, if required by an applicable income tax treaty, are attributable to a U.S. permanent establishment) are subject to U.S. federal income tax on a net income basis in the same manner as if the non-U.S. holder were a U.S. holder, and may be subject to an additional “branch profits tax” at a 30% rate or such lower rate as may be specified by an applicable income tax treaty.
95
Table of Contents
If we are treated as a U.S. corporation pursuant to Section 7874 of the Code, non-U.S. holders generally will be subject to withholding tax at a rate of 30% on all dividends paid by us, unless a reduced rate of tax is available under a tax treaty or the dividends are exempt from withholding because they are effectively connected with a non-U.S. holder’s conduct of a U.S. trade or business (and, in each case, the relevant certification requirements are satisfied).
Information Reporting and Back-up Withholding
U.S. holders generally are subject to information reporting requirements with respect to dividends paid on Class A common shares, and on the proceeds from the sale, exchange or disposition of Class A common shares. In addition, a holder may be subject to back-up withholding (currently at 24%) on dividends paid on Class A common shares, and on the proceeds from the sale, exchange or other disposition of Class A common shares, unless the holder provides certain identifying information, such as a duly executed IRS Form W-9, W-8BEN or W-8BEN-E, or otherwise establishes an exemption. Back-up withholding is not an additional tax and the amount of any back-up withholding will be allowable as a credit against a holder’s U.S. federal income tax liability and may entitle such holder to a refund, provided that certain required information is timely furnished to the IRS.
Marshall Islands Taxation
In the opinion of our Marshall Islands tax counsel, Seward & Kissel LLP, because we do not (and do not expect in the future that we will) conduct business or operations in the Republic of The Marshall Islands, we are not subject to income, capital gains, profits or other taxation under current Marshall Islands law. Distributions on our Class A common shares or on our Series B Preferred Shares will not be subject to Marshall Islands withholding tax.
Other Taxation
We are subject to taxation in certain non-U.S. jurisdictions because we are either organized, or conduct business or operations, in such jurisdictions. We intend that our business and the business of our subsidiaries will be conducted and operated in a manner that minimizes taxes imposed upon us and our subsidiaries. However, we cannot assure this result as tax laws in these or other jurisdictions may change or we may enter into new business transactions relating to such jurisdictions, which could affect our tax liability.
96
Table of Contents
UNDERWRITING (CONFLICTS OF INTEREST)
Subject to the terms and conditions set forth in the underwriting agreement between us and B. Riley FBR, Inc. (the “Underwriter” or “B. Riley”), we have agreed to sell to the underwriter and the underwriter has agreed to purchase from us, 6,620,686 shares of our Class A common shares (“Common Stock”).
| Underwriter |
Number of Shares | |||
| B. Riley FBR, Inc. |
6,620,686 | |||
| Total |
6,620,686 | |||
Under the terms of the underwriting agreement, the underwriter agreed to purchase shares of Common Stock from us at a price of $6.78 per share, on all shares, except for 168,965 shares that have been sold to certain executive management members for which the underwriter agreed to purchase such shares from us at the public offering price. The offering will result in net proceeds to us, after deducting estimated expenses related to this offering, of approximately $44.6 million assuming no exercise of the option to purchase additional shares granted to the underwriters, and $51.3 million assuming full exercise of the option to purchase additional shares.
The underwriter proposes to offer shares of Common Stock to the public, dealers, and institutional clients from time to time for sale in one or more transactions on the New York Stock Exchange at or below the public offering price set forth on the front cover page of this prospectus. The underwriter’s obligation to purchase the shares is subject to satisfaction of certain conditions, including, among others, the continued accuracy of representations and warranties made by us in the underwriting agreement, delivery of legal opinions and the absence of any material changes in our assets, business or prospects after the date of this prospectus. B. Riley Financial, Inc. and its affiliate have agreed to purchase shares of Common Stock in the offering at the public offering price and have agreed to hold shares of Common Stock with an aggregate value of at least $15 million following the consummation of this offering. B. Riley Financial, Inc. is the parent company of B. Riley FBR. The Company has agreed to register the resale of such shares of Common Stock held by B. Riley Financial Inc. and its affiliates, as described below under “Conflicts of Interest” and “Registration Rights.”
The following table shows the per share and total public offering price, underwriting discounts and commissions and proceeds to us, assuming both no exercise and full exercise of the underwriter’s option to purchase additional shares of our Common Stock. The public offering price set forth below indicates the maximum price per share that the underwriter will reoffer in this offering.
| Total | ||||||||||||
| Per Share | No Exercise | Full Exercise | ||||||||||
| Public offering price |
$ | 7.25 | $ | 47,999,974 | $ | 55,199,963 | ||||||
| Underwriting discounts and commissions(1) |
$ | 0.47 | $ | 3,032,309 | $ | 3,499,067 | ||||||
| Proceeds, before expenses, to us |
$ | 6.79 | $ | 44,967,665 | $ | 51,700,896 | ||||||
| (1) | The underwriter will not receive any underwriting discounts or commissions on 168,965 Class A common shares sold to certain executive management members. |
We estimate that the total expenses of the offering payable by us will be approximately $400,000. We have agreed to reimburse the Representative for certain of their expenses, including reasonable fees of legal counsel in an amount not to exceed $85,000 and road show and other marketing expenses that we estimate will be approximately $40,000.
Certain executive management members have agreed to purchase a total of 168,965 shares in this offering at the public offering price set forth on the front cover page of this prospectus.
97
Table of Contents
Option to Purchase Additional Shares
We have granted to the underwriter an option to purchase up to 993,102 additional shares of our Common Stock at a price of $6.78 per share. The underwriter may exercise this option in whole or in part at any time within 30 days after the date of the underwriting agreement. To the extent the underwriter exercises this option, the underwriter will be committed, so long as the conditions of the underwriting agreement are satisfied, to purchase a number of such additional shares.
Right of First Refusal
In connection with this offering, we granted B. Riley FBR a right of first refusal, subject to completion of this offering, for a period of 12 months from the date of completion of this offering to act as (i) the lead underwriter in connection with any public offering of equity or equity-linked securities, subject to compliance with FINRA Rule 5110(f)(2); and (ii) initial purchaser and/or lead placement agent in any private offering of equity or equity-linked securities.
Stabilization
In order to facilitate the offering of the Common Stock, the underwriter may engage in transactions that stabilize, maintain or otherwise affect the price of the Common Stock. Specifically, the underwriter may sell more shares than it is obligated to purchase under the underwriting agreement, creating a short position. A short sale is covered if the short position is no greater than the number of shares available for purchase by the underwriters under the option. The underwriters can close out a covered short sale by exercising the option or purchasing shares in the open market. In determining the source of shares to close out a covered short sale, the underwriters will consider, among other things, the open market price of shares compared to the price available under the option. The underwriters may also sell shares in excess of the option, creating a naked short position. The underwriters must close out any naked short position by purchasing shares in the open market. A naked short position is more likely to be created if the underwriter is concerned that there may be downward pressure on the price of the Common Stock in the open market after pricing that could adversely affect investors who purchase in this offering. As an additional means of facilitating this offering, the underwriter may bid for, and purchase, shares of Common Stock in the open market to stabilize the price of the Common Stock. These activities may raise or maintain the market price of the Common Stock above independent market levels or prevent or retard a decline in the market price of the Common Stock. The underwriter is not required to engage in these activities and may end any of these activities at any time.
These activities may have the effect of raising or maintaining the market price of our Common Stock or preventing or retarding a decline in the market price of our Common Stock. As a result of these activities, the price of our Common Stock may be higher than the price that might otherwise exist in the open market. These transactions may be effected on the New York Stock Exchange or otherwise and, if commenced, may be discontinued at any time.
Neither we nor the underwriter make any representation or prediction as to the direction or magnitude of any effect that the transactions described above may have on the price of our Common Stock. In addition, neither we nor the underwriters make any representation that it will engage in these stabilizing transactions or that any transaction, once commenced, will not be discontinued without notice.
Conflicts of Interest
B. Riley FBR has reoffered to B. Riley Financial, Inc. and B. Riley BRC Partners Opportunity Fund, LP (together, “B. Riley Purchasers”), and B. Riley Purchasers have agreed to purchase, an aggregate of approximately $13.0 million of shares of Common Stock in the offering at the public offering price. B. Riley Purchasers intend to hold at least $15.0 million shares of Common Stock following the consummation of this offering. Each of B. Riley FBR and the general partner of BRC Partners Opportunity Fund, LP is a direct or indirect wholly-owned subsidiary of B. Riley Financial Inc. and such entities have a significant number of
98
Table of Contents
overlapping personnel who perform services for each. Accordingly, B. Riley Financial, Inc. will indirectly bear all of the economic risk and receive all of the economic benefit of any gain relating to ownership of such shares. In addition, following the completion of this offering and subject to certain conditions, we agreed to grant B. Riley Purchasers the right to appoint one (1) member to our Board of Directors until such time when B. Riley Purchasers and its affiliates hold less than 5% of the total voting power of our Common Stock. As a result of the ownership by B. Riley Purchasers of the shares purchased in the offering and their right to appoint a member of our Board and the affiliation between such entities, B. Riley FBR will be deemed an affiliate of the Company. Accordingly, this offering is being made in compliance with the requirements of FINRA Rule 5121. The appointment of a “qualified independent underwriter” is not required in connection with this offering as a “bona fide public market,” as defined in FINRA Rule 5121, exists for our Common Stock. Pursuant to FINRA Rule 5110(g)(1), except as permitted by FINRA Rule 5110(g)(2), the shares acquired by B. Riley Purchasers may not be sold, transferred, assigned, pledged or hypothecated, or be the subject of any hedging, short sale, derivative, put or call transaction that would result in the effective economic disposition of the securities until 180 days after the date of this prospectus.
B. Riley FBR and its affiliates are full service financial institutions engaged in various activities, which may include securities trading, commercial and investment banking, financial advisory, investment management, investment research, principal investment, financing and brokerage activities. B. Riley FBR and its affiliates have, from time to time, performed, and may in the future perform, various financial advisory and investment banking services for us, for which they received or will receive customary fees and expenses.
In addition, in the ordinary course of their various business activities, B. Riley and its affiliates may make or hold a broad array of investments and actively trade debt and equity securities (or related derivative securities) and financial instruments (including bank loans) for their own account and for the accounts of their customers and may at any time hold long and short positions in such securities and instruments. Such investment and securities activities may involve our securities and instruments. B. Riley FBR and its affiliates may also make investment recommendations or publish or express independent research views in respect of such securities or instruments and may at any time hold, or recommend to clients that they acquire, long or short positions in such securities and instruments.
Registration Rights
We have agreed to enter into a registration rights agreement with B. Riley Purchasers, pursuant to which we will agree to register any shares of Common Stock held by B. Riley Purchasers following the completion of this offering to the extent such shares constitute restricted securities under applicable rules and regulations of the SEC.
Lockup Agreement
We and our directors and executive officers (collectively, the “Locked-Up Stockholders”) have agreed with the underwriter, subject to certain exceptions, not to sell or transfer any Common Stock or securities convertible into, exchangeable for, exercisable for, or repayable with Common Stock, during the period from the date of this prospectus supplement until 90 days after the date of this prospectus supplement, except with the prior written consent of B. Riley FBR. Specifically, we and these other persons have agreed, with certain limited exceptions, not to directly or indirectly:
| • | offer, pledge, announce the intention to sell, sell, contract to sell, sell any option or contract to purchase, purchase any option or contract to sell, grant any option, right or warrant to purchase, make any short sale or otherwise transfer or dispose of, directly or indirectly, any shares of Common Stock or any securities convertible into, exercisable or exchangeable for or that represent the right to receive Common Stock; |
| • | enter into any swap or other agreement that transfers, in whole or in part, any of the economic consequences of ownership of the Common stock; |
| • | make any demand for or exercise any right with respect to, the registration of any Common Stock or any security convertible into or exercisable for Common Stock; or |
| • | publicly disclose the intention to do any of the foregoing. |
99
Table of Contents
The foregoing restrictions do not apply to transactions relating to (i) the exercise or conversion of any stock option or warrant to purchase Common Stock respectively, outstanding as of the date of this prospectus supplement, (ii) grants of employee stock options to purchase common stock pursuant to any of our benefit plans and any related issuances of Common Stock with respect to such awards, (iii) issuances of shares of Common Stock pursuant to an existing stock purchase plan, (iv) the establishment of any contract, instruction or plan that satisfies all of the requirements of Rule 10b5-1 under the Exchange Act; provided that no sales of the securities shall be made pursuant to such plan prior to the expiration of the lockup period, or (v) transfers of common stock by will or intestate succession. The Locked-Up Stockholders are further permitted to transfer common stock by gift, or to any trust for the direct or indirect benefit of such Locked-Up Stockholders, or the immediate family of the Locked-Up Stockholders, provided the transferee agrees to hold the shares of common stock subject to the restrictions applicable to the transferor described above.
Canada
Notice to Canadian Residents (Alberta, British Columbia, Manitoba, Ontario and Québec Only)
This document constitutes an “exempt offering document” as defined in and for the purposes of applicable Canadian securities laws. No prospectus has been filed with any securities commission or similar regulatory authority in Canada in connection with the offer and sale of the Common Stock described herein (the “Securities”). No securities commission or similar regulatory authority in Canada has reviewed or in any way passed upon this document or on the merits of the Securities and any representation to the contrary is an offence.
Canadian investors are advised that this document has been prepared in reliance on section 3A.3 of National Instrument 33-105 Underwriting Conflicts (“NI 33-105”). Pursuant to section 3A.3 of NI 33-105, this document is exempt from the requirement that the issuer and the underwriters in the offering provide Canadian investors with certain conflicts of interest disclosure pertaining to “connected issuer” and/or “related issuer” relationships as may otherwise be required pursuant to subsection 2.1(1) of NI 33-105.
Resale Restrictions
The offer and sale of the Securities in Canada are being made on a private placement basis only and are exempt from the requirement that the issuer prepare and file a prospectus under applicable Canadian securities laws. Any resale of Securities acquired by a Canadian investor in this offering must be made in accordance with applicable Canadian securities laws, which may vary depending on the relevant jurisdiction, and which may require resales to be made in accordance with Canadian prospectus requirements, a statutory exemption from the prospectus requirements, in a transaction exempt from the prospectus requirements or otherwise under a discretionary exemption from the prospectus requirements granted by the applicable local Canadian securities regulatory authority. These resale restrictions may under certain circumstances apply to resales of the Securities outside of Canada.
Representations of Purchasers
Each Canadian investor who purchases the Securities will be deemed to have represented to the issuer, the underwriters and to each dealer from whom a purchase confirmation is received, as applicable, that the investor (i) is purchasing as principal, or is deemed to be purchasing as principal in accordance with applicable Canadian securities laws, for investment only and not with a view to resale or redistribution; (ii) is an “accredited investor” as such term is defined in section 1.1 of National Instrument 45-106 Prospectus Exemptions or, in Ontario, as such term is defined in section 73.3(1) of the Securities Act (Ontario); and (iii) is a “permitted client” as such term is defined in section 1.1 of National Instrument 31-103 Registration Requirements, Exemptions and Ongoing Registrant Obligations.
Taxation and Eligibility for Investment
Any discussion of taxation and related matters contained in this document does not purport to be a comprehensive description of all of the tax considerations that may be relevant to a Canadian investor when
100
Table of Contents
deciding to purchase the Securities and, in particular, does not address any Canadian tax considerations. No representation or warranty is hereby made as to the tax consequences to a resident, or deemed resident, of Canada of an investment in the Securities or with respect to the eligibility of the Securities for investment by such investor under relevant Canadian federal and provincial legislation and regulations.
Rights of Action for Damages or Rescission
Securities legislation in certain provinces or territories of Canada may provide a purchaser with remedies for rescission or damages if this prospectus supplement (including any amendment thereto) contains a misrepresentation, provided that the remedies for rescission or damages are exercised by the purchaser within the time limit prescribed by the securities legislation of the purchaser’s province or territory. The purchaser should refer to any applicable provisions of the securities legislation of the purchaser’s province or territory for particulars of these rights or consult with a legal advisor.
Language of Documents
Upon receipt of this document, each Canadian investor hereby confirms that it has expressly requested that all documents evidencing or relating in any way to the sale of the Securities described herein (including for greater certainty any purchase confirmation or any notice) be drawn up in the English language only. Par la réception de ce document, chaque investisseur canadien confirme par les présentes qu’il a expressément exigé que tous les documents faisant foi ou se rapportant de quelque manière que ce soit à la vente des valeurs mobilières décrites aux présentes (incluant, pour plus de certitude, toute confirmation d’achat ou tout avis) soient rédigés en anglais seulement.
United Kingdom
The underwriter has represented and agreed that:
| • | it has not made or will not make an offer of the securities to the public in the United Kingdom within the meaning of section 102B of the Financial Services and Markets Act 2000 (as amended) (FSMA) except to legal entities which are authorized or regulated to operate in the financial markets or, if not so authorized or regulated, whose corporate purpose is solely to invest in securities or otherwise in circumstances which do not require the publication by us of a prospectus pursuant to the Prospectus Rules of the Financial Services Authority (FSA); |
| • | it has only communicated or caused to be communicated and will only communicate or cause to be communicated an invitation or inducement to engage in investment activity (within the meaning of section 21 of FSMA) to persons who have professional experience in matters relating to investments falling within Article 19(5) of the Financial Services and Markets Act 2000 (Financial Promotion) Order 2005 or in circumstances in which section 21 of FSMA does not apply to us; and |
| • | it has complied with and will comply with all applicable provisions of FSMA with respect to anything done by it in relation to the securities in, from or otherwise involving the United Kingdom. |
Switzerland.
The securities will not be offered, directly or indirectly, to the public in Switzerland and this prospectus does not constitute a public offering prospectus as that term is understood pursuant to article 652a or 1156 of the Swiss Federal Code of Obligations.
101
Table of Contents
European Economic Area.
In relation to each Member State of the European Economic Area (the “EEA”) which has implemented the European Prospectus Directive (each, a “Relevant Member State”), an offer of our shares may not be made to the public in a Relevant Member State other than:
| • | to any legal entity which is a qualified investor, as defined in the European Prospectus Directive; |
| • | to fewer than 100 or, if the Relevant Member State has implemented the relevant provision of the 2010 PD Amending Directive, 150 natural or legal persons (other than qualified investors as defined in the European Prospectus Directive), subject to obtaining the prior consent of the relevant dealer or dealers nominated by us for any such offer, or |
| • | in any other circumstances falling within Article 3(2) of the European Prospectus Directive, |
provided that no such offer of our shares shall require us or any underwriter to publish a prospectus pursuant to Article 3 of the European Prospectus Directive or supplement prospectus pursuant to Article 16 of the European Prospectus Directive.
For the purposes of this description, the expression an “offer to the public” in relation to the securities in any Relevant Member State means the communication in any form and by any means of sufficient information on the terms of the offer and the securities to be offered so as to enable an investor to decide to purchase or subscribe for the securities, as the expression may be varied in that Relevant Member State by any measure implementing the European Prospectus Directive in that member state, and the expression “European Prospectus Directive’’ means Directive 2003/71/EC (and amendments hereto, including the 2010 PD Amending Directive, to the extent implemented in the Relevant Member State) and includes any relevant implementing measure in each Relevant Member State. The expression 2010 PD Amending Directive means Directive 2010/73/EU.
Israel
In the State of Israel this prospectus shall not be regarded as an offer to the public to purchase shares of Common Stock under the Israeli Securities Law, 5728—1968, which requires a prospectus to be published and authorized by the Israel Securities Authority, if it complies with certain provisions of Section 15 of the Israeli Securities Law, 5728–1968, including, inter alia, if: (i) the offer is made, distributed or directed to not more than 35 investors, subject to certain conditions (the “Addressed Investors”); or (ii) the offer is made, distributed or directed to certain qualified investors defined in the First Addendum of the Israeli Securities Law, 5728—1968, subject to certain conditions (the “Qualified Investors”). The Qualified Investors shall not be taken into account in the count of the Addressed Investors and may be offered to purchase securities in addition to the 35 Addressed Investors. The company has not and will not take any action that would require it to publish a prospectus in accordance with and subject to the Israeli Securities Law, 5728—1968. We have not and will not distribute this prospectus or make, distribute or direct an offer to subscribe for our Common Stock to any person within the State of Israel, other than to Qualified Investors and up to 35 Addressed Investors.
Qualified Investors may have to submit written evidence that they meet the definitions set out in of the First Addendum to the Israeli Securities Law, 5728—1968. In particular, we may request, as a condition to be offered Common Stock, that Qualified Investors will each represent, warrant and certify to us and/or to anyone acting on our behalf: (i) that it is an investor falling within one of the categories listed in the First Addendum to the Israeli Securities Law, 5728—1968; (ii) which of the categories listed in the First Addendum to the Israeli Securities Law, 5728—1968 regarding Qualified Investors is applicable to it; (iii) that it will abide by all provisions set forth in the Israeli Securities Law, 5728—1968 and the regulations promulgated thereunder in connection with the offer to be issued Common Stock; (iv) that the shares of Common Stock that it will be issued are, subject to exemptions available under the Israeli Securities Law, 5728—1968: (a) for its own account; (b) for investment purposes only; and (c) not issued with a view to resale within the State of Israel, other than in accordance with the provisions of the Israeli Securities Law, 5728—1968; and (v) that it is willing to provide further evidence of
102
Table of Contents
its Qualified Investor status. Addressed Investors may have to submit written evidence in respect of their identity and may have to sign and submit a declaration containing, inter alia, the Addressed Investor’s name, address and passport number or Israeli identification number.
We have not authorized and do not authorize the making of any offer of securities through any financial intermediary on our behalf, other than offers made by the underwriter and its affiliates, with a view to the final placement of the securities as contemplated in this document. Accordingly, no purchaser of the shares, other than the underwriter, is authorized to make any further offer of shares on our behalf or on behalf of the underwriter.
103
Table of Contents
ENFORCEMENT OF CIVIL LIABILITIES
We are organized under the laws of the Marshall Islands as a corporation. The Marshall Islands has a less developed body of securities laws as compared to the United States and provides protections for investors to a significantly lesser extent.
Most of our directors and officers and those of our subsidiaries are residents of countries other than the United States. Substantially all of our and our subsidiaries’ assets and a substantial portion of the assets of our directors and officers are located outside the United States. As a result, it may be difficult or impossible for United States investors to effect service of process within the United States upon us, our directors or officers, or our subsidiaries or to realize against us or them judgments obtained in United States courts, including judgments predicated upon the civil liability provisions of the securities laws of the United States or any state in the United States. However, we have expressly submitted to the jurisdiction of the U.S. federal and New York state courts sitting in the City of New York for the purpose of any suit, action or proceeding arising under the securities laws of the United States or any state in the United States.
In addition, there is uncertainty as to whether the courts of the Marshall Islands would (1) recognize or enforce against us or our directors or officers judgments of courts of the United States based on civil liability provisions of applicable U.S. federal and state securities laws; or (2) impose liabilities against us or our directors and officers in original actions brought in the Marshall Islands, based on these laws.
104
Table of Contents
The validity of the common shares offered by this prospectus and certain other legal matters relating to United States and Marshall Islands law are being passed upon for us by Seward & Kissel LLP, New York, New York. The underwriters are being represented in this offering by Morgan, Lewis & Bockius LLP, Palo Alto, California.
The financial statements as of December 31, 2018 and for the year ended December 31, 2018 incorporated by reference into this Prospectus have been so incorporated in reliance on the report (which contains an explanatory paragraph disclosing that the Company has entered into significant contracts with CMA CGM, a related party and the main source of the Company’s operating revenue, as described in Note 2(a) to the financial statements) of PricewaterhouseCoopers S.A., an independent registered public accounting firm, given on the authority of said firm as experts in auditing and accounting.
The financial statements as of December 31, 2017 and for each of the two years in the period ended December 31, 2017 incorporated by reference into this Prospectus have been so incorporated in reliance on the report (which contains an explanatory paragraph disclosing that the Company has entered into significant contracts with CMA CGM, a related party and the main source of the Company’s operating revenue, as described in Note 2(a) to the financial statements) of PricewaterhouseCoopers Audit, an independent registered public accounting firm, given on the authority of said firm as experts in auditing and accounting.
The industry information attributed to MSI throughout this prospectus, including under the headings “Prospectus Summary-Industry Overview” and “The International Container Shipping and Containership Leasing Industry”, has been reviewed by MSI, which has confirmed to us that such information accurately describes the container shipping market.
WHERE YOU CAN FIND ADDITIONAL INFORMATION
We have filed with the SEC a registration statement on Form F-1 under the Securities Act with respect to our common shares offered by this prospectus. For the purposes of this section, the term “registration statement” means the original registration statement and any and all amendments, including the schedules and exhibits to the original registration statement or any amendment. This prospectus does not contain all of the information set forth in the registration statement on Form F-1 we filed. Although we believe that we have accurately summarized the material terms of documents filed as exhibits to the registration statement, you should read those exhibits for a complete statement of their provisions. The registration statement on Form F-1, including its exhibits and schedules, may be inspected and copied at the public reference facilities maintained by the SEC at 100 F Street, N.E., Washington, D.C. 20549. You may obtain information on the operation of the public reference room by calling 1 (800) SEC-0330, and you may obtain copies at prescribed rates from the Public Reference Section of the SEC at its principal office in Washington, D.C. 20549. The SEC maintains a website (http://www.sec.gov) that contains reports, proxy and information statements and other information regarding registrants that file electronically with the SEC.
Information Incorporated by Reference
The Commission allows us to “incorporate by reference” information that we file with it. This means that we can disclose important information to you by referring you to those filed documents. The information incorporated by reference is considered to be a part of this prospectus, and information that we file later with the Commission prior to the termination of this offering will also be considered to be part of this prospectus and will automatically update and supersede previously filed information, including information contained in this document.
105
Table of Contents
We hereby incorporate by reference the documents listed below.
| • | Our Annual Report on Form 20-F for the year ended December 31, 2018, filed with the Commission on March 29, 2019, containing our audited consolidated financial statements for the most recent fiscal year for which those statements have been filed. |
| • | Our Report of Foreign Private Issuer on Form 6-K, filed with the Commission on May 31, 2019 (except for the commentary of the Company’s Executive Chairman and Chief Executive Officer). |
| • | Our Report of Foreign Private Issuer on Form 6-K, filed with the Commission on August 9, 2019, which contains our management’s discussion and analysis of financial condition and results of operations and unaudited interim consolidated financial statements and related notes for the six month period ended June 30, 2019. |
| • | Our Report of Foreign Private Issuer on Form 6-K, filed with the Commission on September 24, 2019 (except for any reference to, or information contained in, the Company’s website and the statements attributed to the Company’s Chairman and Chief Executive Officer contained in Exhibit 99.1 thereto). |
You should rely only on the information contained or incorporated by reference in this prospectus. We have not authorized any other person to provide you with different information. If anyone provides you with different or inconsistent information, you should not rely on it. We are not making an offer to sell these securities in any jurisdiction where the offer or sale is not permitted. You should assume that the information appearing in this prospectus as well as the information we previously filed with the Commission and incorporated by reference, is accurate as of the dates on the front cover of those documents only. Our business, financial condition and results of operations and prospects may have changed since those dates.
You may request a free copy of the above-mentioned filings or any subsequent filing we incorporate by reference to this prospectus by writing or telephoning us at the following address:
Global Ship Lease, Inc.
Attn: Ian J. Webber
c/o Global Ship Lease Services Limited
25 Wilton Road
London SW1V 1LW
United Kingdom
+44 (0) 20 3998 0063
www.globalshiplease.com
Information provided by the Company
We will furnish holders of our Class A common shares and Series C Preferred Shares with annual reports containing audited financial statements and a report by our independent registered public accounting firm. The audited financial statements will be prepared in accordance with United States generally accepted accounting principles and those reports will include a “Management’s Discussion and Analysis of Financial Condition and Results of Operations” section for the relevant periods. As a “foreign private issuer,” we are exempt from the rules under the Exchange Act prescribing the furnishing and content of proxy statements to shareholders. While we intend to furnish proxy statements to any shareholder in accordance with the rules of the NYSE, those proxy statements are not expected to conform to Schedule 14A of the proxy rules promulgated under the Exchange Act. In addition, as a “foreign private issuer,” we are exempt from the rules under the Exchange Act relating to short swing profit reporting and liability.
106
Table of Contents
OTHER EXPENSES OF ISSUANCE AND DISTRIBUTION
We estimate the expenses in connection with the distribution of our common shares in this offering, other than underwriting discounts and commissions, will be as set forth in the table below. We will be responsible for paying the following expenses associated with this offering.
| SEC Registration Fee |
$ | 5,575.20 | ||
| Printing and Engraving Expenses |
$ | 50,000.00 | ||
| Legal Fees and Expenses |
$ | 150,000.00 | ||
| Accountants’ Fees and Expenses |
$ | 150,000.00 | ||
| NYSE Listing Fee |
$ | 26,000.00 | ||
| FINRA Fee |
$ | 7,400.00 | ||
| Miscellaneous Costs |
$ | 11,024.80 | ||
| Total |
$ | 400,000.00 |
107
Table of Contents
6,620,686 Class A Common Shares
Global Ship Lease, Inc.
PROSPECTUS
| B. Riley FBR | ||
September 26, 2019